


FTSE 100 Index Summer Outlook
Stock-Markets / UK Stock Market Apr 28, 2007 - 07:19 PM GMTBy: Nadeem_Walayat
 The standing forecast as of December 06 for 2007 is for the FTSE to rally towards 7000 by year end, however a strong summer correction is also anticipated to begin sometime during May 2007 and carry into July 07. The following analysis is an attempt at fine tuning the Outlook for the Summer FTSE 100 Correction
The FTSE has had a strong run so far this year, the weakness during March which hit and held the primary support target of 6000. Subsquent price action showed strength with failure to revisit and break the 6000. This set the scene for the current strong rally to new high for the year.
However, I expect the anticipated implications of further interest rate hikes towards 5.75% during the next few months to impact on the UK Stock Market as the global bond markets take a tumble on the back of rising rates across the globe and a weakening US Dollar.
Additionally another run of Yen Carry Trade unwinding as occurred during February will further accelerate the corrective move and then there is China's parabolic stock market rally to content with, which is primed for a crash.
On the commodities front - Inflation is on the rise, and we can expect another surge in Crude Oil towards $80 this summer, thus priming the FTSE 100 Index for serious stock market weakness, in many ways similar to last years sell off.
Technical Analysis
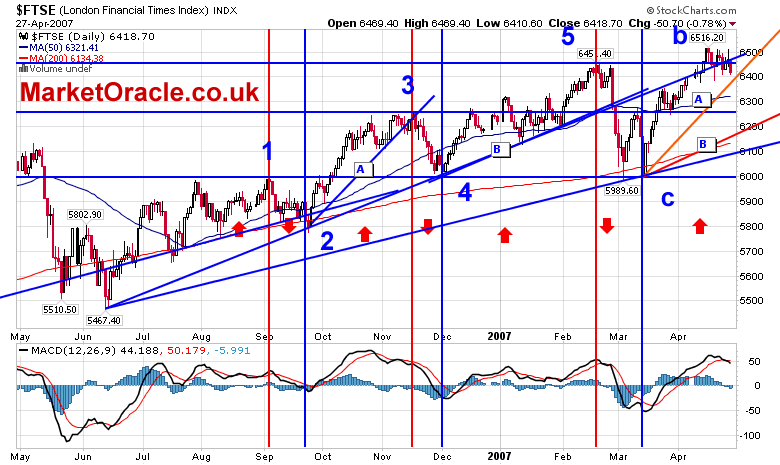
1. Trend Analysis - The break above the 6450 high is a sign of strength which implies that the initial correction lower won't break support at 6000. Therefore we can put that in as a floor for any correction. Saying that before the FTSE can get to the target floor of 6000 it has to overcome many obstacles in its path, one of the main ones is the fact that it is still in an uptrend going into May. Projecting the A and B trendlines that previously triggered significant sell offs gives us the key triggering levels currently at 6400 and 6180. These need to be broken before the start of the correction can be confirmed.
2. MACD Indicator - The MACD cross is signaling stock market weakness ahead, therefore any further rally can be expected to be weak. However as the past as shown the FTSE can slowly snake along an overbought MACD state for some months before the final breakdown.
3. Time Analysis - The Current bull run from March, is not overbought time wise thus confirming likely hood that there is some more upside in the market. It could run for another couple of weeks to a couple of months even. The downside trend is expected to last between 4 and 8 weeks.
4. Elliott Waves - I use Elliott waves sparingly as a secondary indicator, and NOT primary. In that light, the wave count I had as evident on the chart was for a peak in March. Thus, I was expecting a weak B wave rally, but the rally to 6516 has changed that, which is a sign of strength and means that I have to ignore elliott wave theory in this regard. Some could say the wave count is wrong, but its not, its just that elliott wave theory does not work all of the time ! Which is something that elliott obsessive tend to forget. At best it works 50% of the time, but in this case its NOT working and I don't subscribe to the fancy x,y,z triple zig zag zog nonsense either. So Elliott wave is not working for the FTSE, BUT the break above 6450 implies strength. which implies more upside action.
Conclusion
The anticipated FTSE 100 Index correction starting in May 2007 looks likely to be delayed somewhat. There is no real sign that it is imminent. The key level to watch for is a break of the A trendline which is a triggering trendline off of the Sept 06 low. The correction would be targeting 6000, but could be volatile as there are many obstacles to overcome on route to 6000.
Related:
23 Apr 2007 - Financial Markets Review - Sell in May and Go Away
23 Apr 2007 - Summary of Financial Markets and Economic Forecasts
22 Apr 2007 - UK Interest Rates to Rise to 5.50% on May 10th , What's Next ?
29 Dec 2006 - FTSE 100 Index stock market forecast for 2007
By Nadeem Walayat
(c) MarketOracle.co.uk 2007
The Market Oracle is a FREE Daily Financial Markets Forecasting & Analysis online publication. We present in-depth analysis from a range of experienced market analysts on their views of the probable direction of the financial markets. Thus enabling our readers to arrive at an informed opinion on market direction http://www.marketoracle.co.uk
This article maybe reproduced if reprinted in its entirety with links to http://www.marketoracle.co.uk
© 2005-2022 http://www.MarketOracle.co.uk - The Market Oracle is a FREE Daily Financial Markets Analysis & Forecasting online publication.