


Analysis of a V Shaped Stock Market Bottom
Stock-Markets / Stocks Bull Market Mar 13, 2009 - 01:14 PM GMTBy: Roland_Watson

 The consensus I tend to read amongst market commentators is that when this market bottoms, it will be a V shaped affair. Now I mainly write on precious metals but it will be foolhardy to presume that the fortunes of these two separate assets classes are not linked in some way. After all, if money is flowing back into the stock market, that means there is less money to flow into other asset classes such as gold and silver bullion products. I am also aware that most investors will be diversified in their asset allocation and will not only be holding gold or silver but will also be looking to re-invest in general equities at an opportune time.
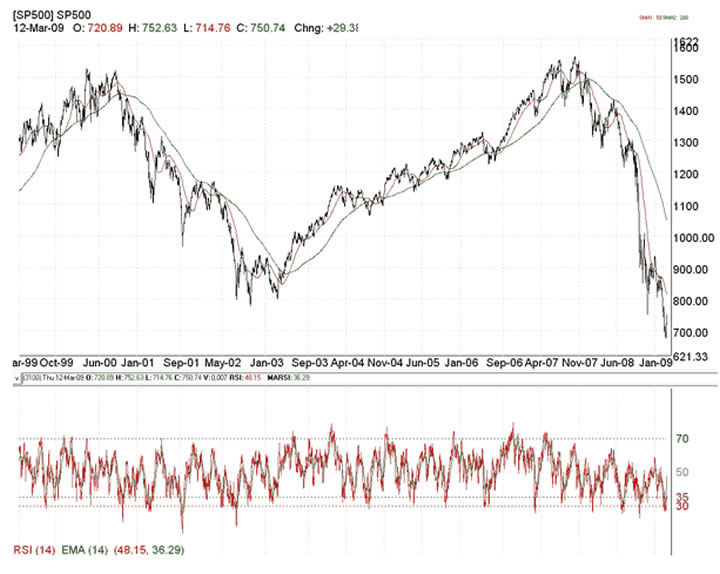
People may say that the 2000-2009 bear market will have put many investors off equities but that in my opinion is a different matter to how the market will actually perform in term of percentage gains. The truth is that hard sell offs lead to hard buy ups. To get an idea of how the rebound in the markets may pan out, let us look at the equally great bear market of 1968 to 1974. First we chart out the current bear market below for the S&P 500.
Let me start off by giving another opinion. If this rally extends to over 800 then the 9 year bear is most likely over and done with and I will explain why to subscribers. But now we display the chart for the 1968 to 1974 bear and its subsequent recovery.
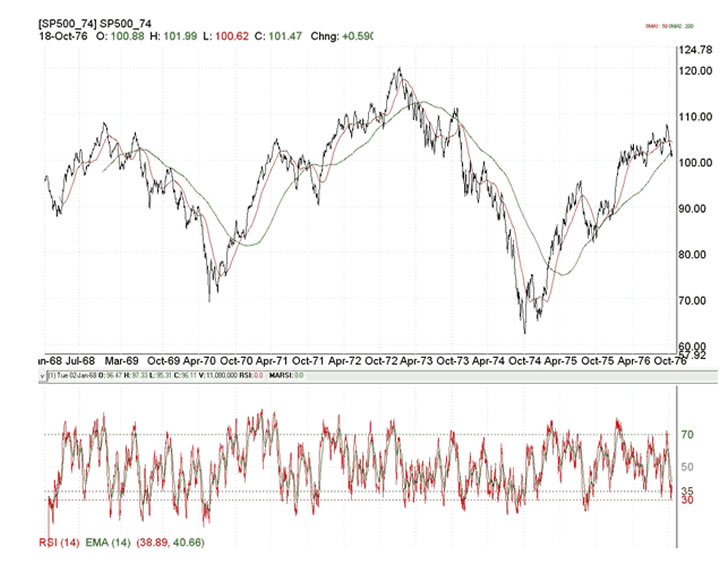
There are some similarities between these markets and to borrow from Mark Twain, bear markets may not repeat but they do rhyme. The bear market began in 1968 as inflation began to grip and an extended bull run from the late 1940s finally exhausted. New highs were made in 1973 but it was no more than an abortive rally and the bear market re-asserted itself with full vigor as the markets plunged 50% as the economic woes of an oil shock and continued inflation took their toll.
As fear gripped the markets, gold in parallel rose from $120 to $200 for a 67% gain but topped out 3 months after the S&P500 bottomed to enter its own 2 year bear market before the historic events of the late 1970s. Included in the chart are the 50 and 200 day moving averages (red and green respectively) and the RSI indicator is in the lower section. Note how the index hugs the 50 day moving average fairly well. When the 50 day moving average got back up above the 200 day average, the recovery was already underway.
But when fear was at a maximum and " blood was flowing in the streets " the market underwent a transformation and on the 7th October 1974 hit a final low of 62. By the following July it had to reached 96 for a 55% gain. By June 1980 the old highs had been reclaimed and the great 1980s bull was in progress. The point being that despite the bad news permeating the markets, the S&P 500 put in an impressive V shaped bottom.
How does that compare to the current down turn? Like 1974, we have a "twin peak" bear where the index drops and rallies to near the old highs before crashing again (this is called a flat wave in Elliott wave terms). Likewise, the markets have shed a similar amount (so far) of about 65%. Like 1974, the S&P 500 is trading tightly below its 50 day moving average.
Meanwhile gold has gained against the S&P500 by 33% during this 15 month drop though the path it took is more erratic than the 1973-1974 drop.
So we have similarities but will the recovery be as dramatic as 1974 to 1975? People say that investors will stay away from equities - especially baby boomers but back in late 1974 investors had endured 6 years of poor stock performance and yet the rebound was great. We should be prepared for a similar event.
How may one play this upcoming surge? There are several ways of approaching this but looking at 1974-1975 one technique that played it safe was to wait until the 50 day moving average climbed back above the 200 day moving average in March 1975. By then the market had gained about 35% which was the price of a less risky approach. Clearly to execute that strategy you need a conviction that the multi-year bear market is over. If you believe the crisis that has hit us this past year is far worse than what happened in the 1970s then you will be obliged to wait longer.
For me, the dawn of major new bull market approaches fast.
By Roland Watson
http://silveranalyst.blogspot.com
Further analysis of the SLI indicator and more can be obtained by going to our silver blog at http://silveranalyst.blogspot.com where readers can obtain the first issue of The Silver Analyst free and learn about subscription details. Comments and questions are also invited via email to silveranalysis@yahoo.co.uk .
Roland Watson Archive |
© 2005-2022 http://www.MarketOracle.co.uk - The Market Oracle is a FREE Daily Financial Markets Analysis & Forecasting online publication.