


Stock Market Another Leg Down?
Stock-Markets / Stocks Bear Market Apr 20, 2009 - 12:45 AM GMTBy: Brian_Bloom

 In this morning’s media, (April 19th 2009) a Reuters article appeared, entitled U.S. transport Q1 earns watched for recovery signs (http://news.yahoo.com/..)
In it, the following statements appeared:
- “According to a monthly index produced by the American Trucking Association's, truck tonnage fell 9.2 percent in February. While bad, it was not as bad as January's 10.8 percent decline or December's 12.5 percent drop.”
- “Freight volumes at U.S. railroads are also off dramatically. For the first 14 weeks of 2009, volumes slid 17.2 percent, according to the Association of American Railroads”
The article also reports the following:
“Morgan Stanley analyst William Greene wrote in a client note "we now expect most rails to outperform our first-quarter estimates," thanks to strong pricing and cost reductions”
It needs to be born in mind that “outperforming estimates” may be a very deceptive concept.
This analyst is of the view that we need to keep our eyes wide open at this juncture. There may be some issues that have yet to come to light. For example, conceptually, if an avaricious bank wanted to stick its hand out to collect a few billion dollars of assistance from the US Government in the December quarter, all it had to do was pass a few journal entries to write down some assets. Then after the money was safely locked away, in the March quarter, some of these journal entries could be reversed and: “Hey Presto! We made a record profit for the March quarter. Aren’t we brilliant?”
We should not lose sight of the fact that we have been living in an extremely unethical era, where bankers (and many others) have become amoral.
By way of illustration of one possible issue, here’s a reality check: In a Reuters article on April 18th 2009 entitled: “Earnings deluge may swamp stock rally” (See: http://news.yahoo.com/s/nm/20090418.. ) the following statement was made:
“Earnings for S&P 500 companies are expected to decline 37.4 percent in the quarter, according to Thomson Reuters data, with all 10 sectors taking a hit.”
To this analyst, this coming earning reporting week will be the acid test. With rolling 12 month GAAP earnings P/E ratios starting at 58.44 (see chart below, courtesy Decisionpoint.com) a further decline of earnings by 37.4% implies P/E ratios will rise further.
What does this mean? For the hell of it, let’s assume that P/E ratios rise to (say) 70X (i.e. earnings fall by “only” 17%) and let’s assume that “Overvalue” P/E ratios of 20 are the logical best case target based on 100 years of history. This implies a potential fall in price of a minimum of roughly 71.4% from current levels. See calculation below:
Price |
Earnings |
P/E Ratio |
$ 58.40 |
$ 1.00 |
58.4 |
$ 58.40 |
$ 0.83 |
70.0 |
$ 16.69 |
$ 0.83 |
20.10 |
(58.40 – 16.69)/ 59.4 = 71.4%
In an article published April 7th 2009 (http://www.usatoday.com/money/economy/2009-04-07-ceo-outlook_N.htm) the following statement appeared:
“Nearly three-quarters of CEOs in the Business Roundtable expect to cut workers in the next six months as sales sag, a survey showed Tuesday, suggesting further deterioration in the job market is likely at least through the end of the year.”
Oops! If 75% of CEOs are expecting revenue to decline, there is no way that earnings will rise from here in the next six months (unless the cheating in reporting continues). So, it seems to me that we may still have another down leg which could lead to a “bloodbath” in the equity markets.
Another issue – in this analyst’s view – is that we have already had the so-called “rush to safety” in the bond markets. Spare cash is already sitting in the bond market. There is likely to be no more spare cash. If I am right in my assessment, then a collapsing equity market is likely to be accompanied by a cash crunch. Now have a look at the chart below (courtesy: DecisionPoint.com)
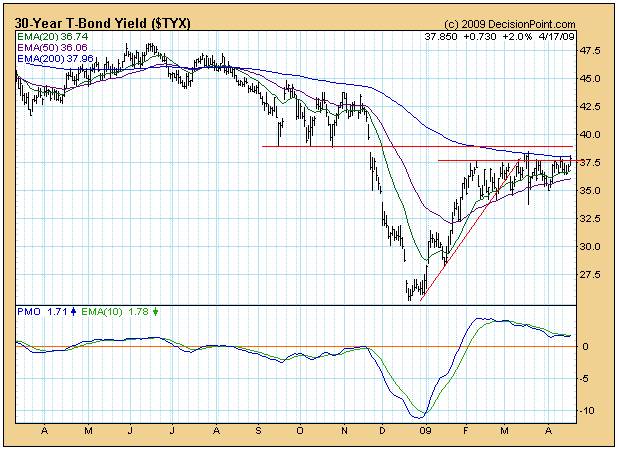
What we are seeing on this chart (I believe) is an ascending right-angled triangle pattern with the resistance level at around 3.76. If that level is penetrated on the upside, the yields could spike upwards. (Too early to make the call at this point)
Nevertheless, should yields break out to the upside, the minimum target will be 4.2% based on horizontal count in the P&F chart below (Courtesy Stockcharts.com):
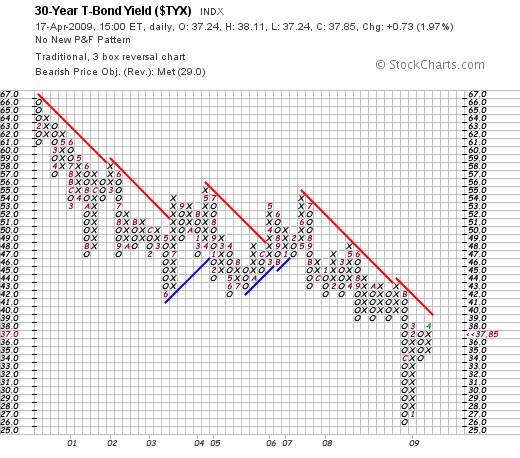
And the spike could be as high as 5.1% based on a vertical count target.
Of course, all this is speculation and guess work on my part, but such a spike – should it happen – will likely cause further chaos in the housing market and, in turn, this will likely cast serious doubt on the value of assets on the banks’ balance sheets. They will no longer be able to pretend that the holding values of affected assets have been marked “to market”.
And it will also cause chaos in the bond markets; as billions of dollars are wiped of the face value of the bonds if and when yields rise.
Finally, it will likely also cause chaos in the derivatives markets as the issue of counterparty risk rises to the fore.
Have a look at the chart of JP Morgan below. JPM is the largest player in the derivatives market. (Chart courtesy Bigcharts.com)
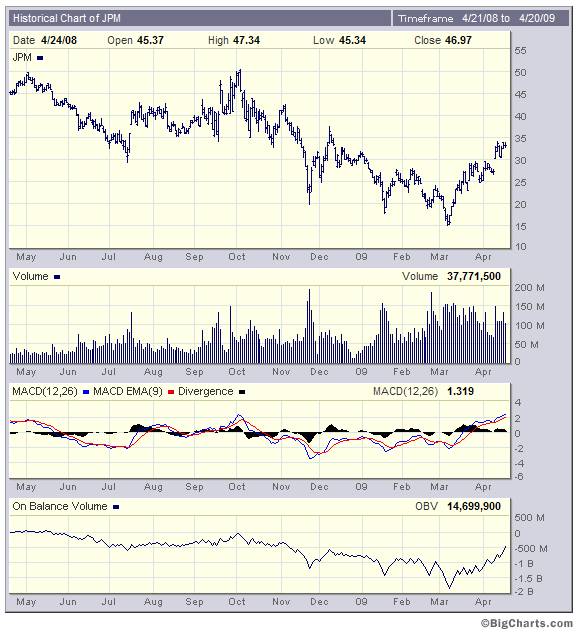
What we see here is an “apparently” strong chart. The price has been rising since March 2008 as has the On Balance Volume chart – which gave a buy signal in late March.
But – and there’s always a but – this buy signal came after a prolonged fall which began in October 2008, when the OBV accumulated total began at zero. At this point in time it is still below zero (around minus 500 million shares) and the MACD is reaching overbought levels. From a trading perspective, JPM may be categorized as a “sell” – particularly given what may turn out to have been an exhaustion gap on the price chart at around 28-30; because it occurred deep into the rally rather than at the beginning of the rally. At the very least, that gap needs to be covered.
But if the price keeps falling and the 25 level is penetrated on the downside that will likely represent a serious sell signal.
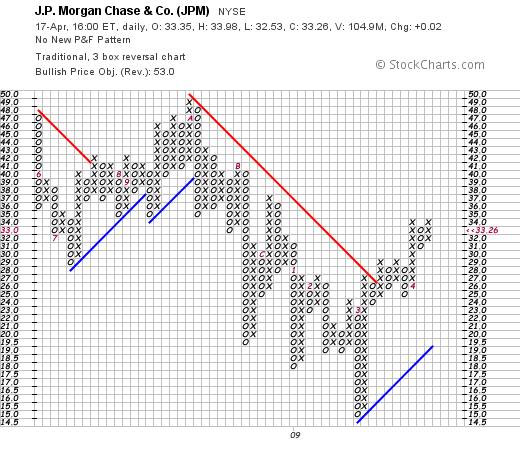
Such a sell signal (should it happen) will bring the price back down to the rising blue trend line.
But, in this analyst’s view, if interest rates spike, that trend line will very likely be penetrated on the downside.
And here we see the potential dangers of basing your “investment” decisions on charting. If you look at the 5% X 3 box reversal of the P&F chart of JPM you will see that it has an unrealized price target of $51.07 (which just happens to be at a breakout level)
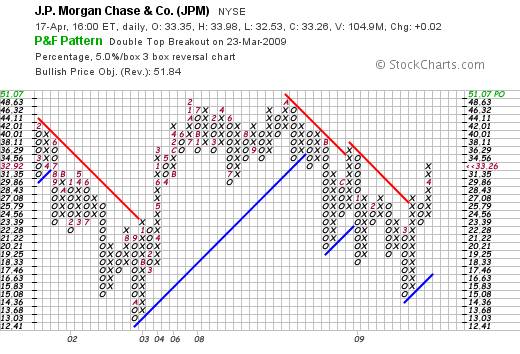
Unfortunately, chart signals can only be relied upon if you have read the Primary Trend correctly. If the Primary Trend is “down” then the above upside target is more likely to be meaningless.
My personal view is that the Primary Trend is down – based, not only on Richard Russell’s reading of Dow Theory on the charts – but based on values. Any way you look at it, the market is dramatically overpriced at a 58.44 P/E ratio and at least fair values will need to re-emerge before the direction of the Primary Trend will change.
So what do we do?
The short answer is that we will all experience some pain. No one will escape it. The question is whether we can minimize the pain.
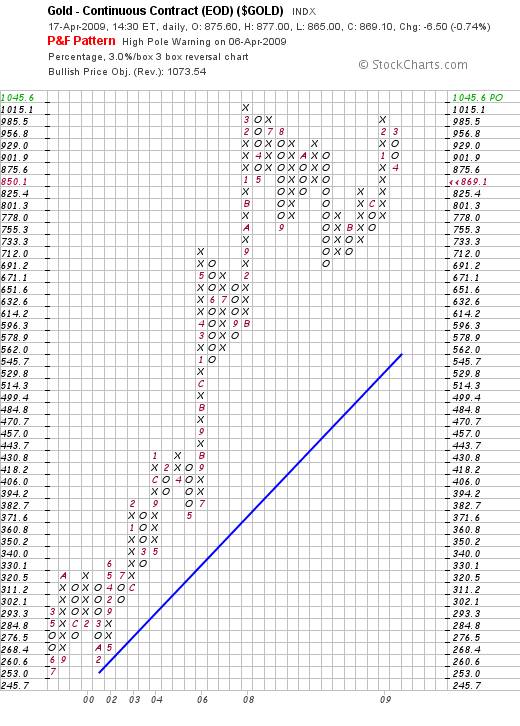
The stock answer to this question has become: “buy gold” and the chart below (courtesy StockCharts.Com) seems to reinforce this.
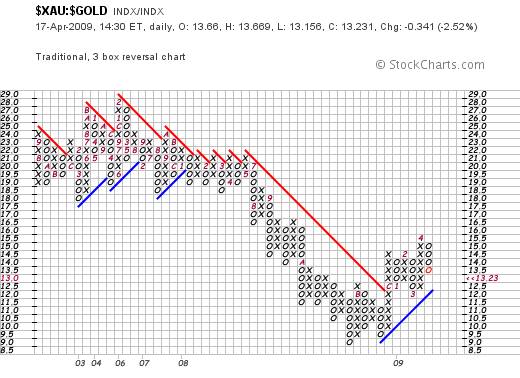
Gold shares usually lead the gold price and the gold share universe has been outperforming the gold price since late 2008. Further, according to the chart below, the gold shares may be looking for a bottom relative to gold based on the MACD oscillator which may be reaching for a bottom.
Further, if the gold price is in a Primary Bull Trend (which I believe it is) then the price target of $1045.60 per ounce below is probably believable.
Yes, the gold price does look very vulnerable in the short term based on the more sensitive Point and Figure chart below
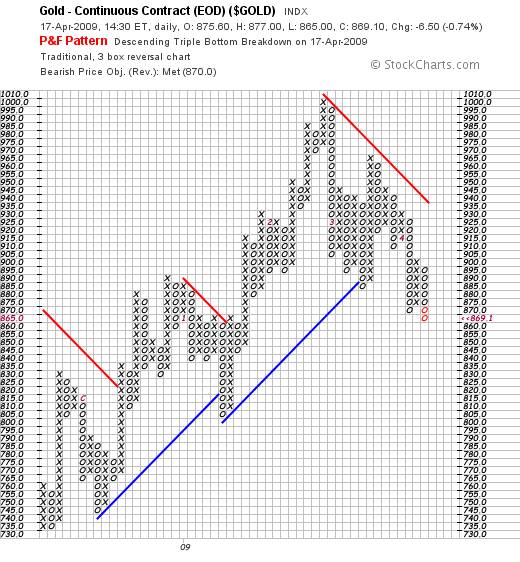
Although the $870 price target has been met, the reader’s attention is drawn to the fact that a “sell” signal that was given when the price broke below $870. This, in turn, gives rise to a price target of $860 using the horizontal count method and the price may fall as low as $845 if there is an over-run and given that the Primary Trend is “up”.
Conclusion
Although it is too early to make any calls based on the charts, the fundamentals are pointing to a grossly overvalued industrial equity market and the technicals are pointing to a possible topping out process of the industrial markets’ bull rally. There is an old adage on the NYSE: “Sell in May and Go Away”. Personally, I would sell now, while the market is still rising. If I’m wrong, well then, I will likely lose “profits” of few percentage points. But, if I’m right, then I am potentially risking over 70% of my capital. (The reader should note that these are personal comments and should not be construed as recommendations).
Author’s Note
There are those who are still steadfastly refusing to face up to the reality that the world has passed Peak Oil and that this has life threatening connotations to the world economy which, in turn, demands that humanity across the planet must change the Thought Paradigms which have stood it in good stead since the mid 1700s. Yes, there are massive reserves of oil tar sands and methane gas which have not yet been tapped, but these will be too expensive to extract and, in context of the recent EPA ruling that CO2 emissions are harmful to health, we absolutely must move away from fossil fuels. (See: http://news.yahoo.com/s/.. )
In my novel, Beyond Neanderthal, (published in June 2008) the recent financial implosion was anticipated and the reasons for the (then likely) implosion were highlighted. Via the medium of its light hearted and entertaining storyline, Beyond Neanderthal points a possible direction out of the quagmire. This direction is not based on the Keynesian economic principles being espoused by the world’s political leaders. Not to put too fine a point on it, the G-20 outcome was a catastrophe for humanity. Just as the Bretton Woods summit was a con-job in that it “appeared” to entrench the gold standard whilst shifting the world onto a dollar standard; so the G-20 summit was a con-job. Whilst it “appeared” to shift the emphasis of world currencies onto the SDR, very few people have focused on the fact that SDRs are “priced” in US Dollars.
Readers who are serious about their financial futures are recommended to go to the IMF website at http://www.imf.org/external/np/fin/data/rms_sdrv.aspx to see exactly how SDRs are valued. By retaining the US Dollar as the world’s ultimate currency, the world’s currency reserves are ultimately still controllable/influenceable by the US Federal Reserve System which, in turn, is controlled by Private Banks who are profit oriented as opposed to socially conscious. Quote: “The currency value of the SDR is determined by summing the values in U.S. dollars, based on market exchange rates, of a basket of major currencies (the U.S. dollar, Euro, Japanese yen, and pound sterling). The SDR currency value is calculated daily and the valuation basket is reviewed and adjusted every five years.”
The bottom line is this: Until we withdraw from the privately owned banks the right to borrow one dollar and then on-lend that same dollar ten times over at higher interest rates (and still charge bank fees on top of that), there will be an ever perpetuating cycle of booms and busts as the credit bubbles inflate and deflate. A perpetually inflating credit bubble will eventually lead to a bursting of that bubble and “all the kings horses and all the kings men will not put that bubble together again”.
We appear to be facing two alternatives:
- We can recognize the need for new Thought Paradigms and act now to explore and implement them, or
- We could wait until the entire system has collapsed before moving to do something substantive – if that option is still available at that time. There are some who argue that we might be facing an era of hyperinflation. The evidence seems to suggest that, rather than hyperinflation, we are facing the risk of a further down leg in the Primary Bear Market and a total systemic collapse. Either way (inflation or deflation) the system is facing the risk of collapse.
At this point in time it is still too early to make a call. At this point in time there is still time for wisdom to prevail. Perhaps a starting point will be to buy a copy of Beyond Neanderthal. It presents several possibilities regarding new Thought Paradigms.
By Brian Bloom
Beyond Neanderthal is a novel with a light hearted and entertaining fictional storyline; and with carefully researched, fact based themes. In Chapter 1 (written over a year ago) the current financial turmoil is anticipated. The rest of the 430 page novel focuses on the probable causes of this turmoil and what we might do to dig ourselves out of the quagmire we now find ourselves in. The core issue is “energy”, and the story leads the reader step-by-step on one possible path which might point a way forward. Gold plays a pivotal role in our future – not as a currency, but as a commodity with unique physical characteristics that can be harnessed to humanity's benefit. Until the current market collapse, there would have been many who questioned the validity of the arguments in Beyond Neanderthal. Now the evidence is too stark to ignore. This is a book that needs to be read by large numbers of people to make a difference. It can be ordered over the internet via www.beyondneanderthal.com
Copyright © 2009 Brian Bloom - All Rights Reserved
Disclaimer: The above is a matter of opinion provided for general information purposes only and is not intended as investment advice. Information and analysis above are derived from sources and utilising methods believed to be reliable, but we cannot accept responsibility for any losses you may incur as a result of this analysis. Individuals should consult with their personal financial advisors.
Brian Bloom Archive |
© 2005-2022 http://www.MarketOracle.co.uk - The Market Oracle is a FREE Daily Financial Markets Analysis & Forecasting online publication.