


Gold's Manipulated Slow Stead Climb Higher
Commodities / Gold & Silver 2009 May 17, 2009 - 11:59 AM GMTBy: Merv_Burak

 It’s been a steady climb all week, even on minus days the lows were always higher. However, the action still is not enthusiastic. Not that gold is about to plunge, it’s just that it doesn’t seem to be getting anywhere fast.
GOLD - LONG TERM
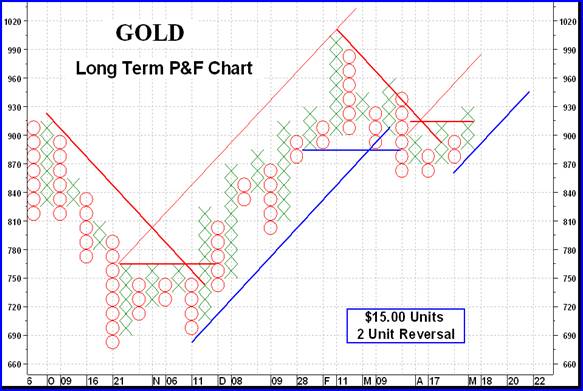
There are basically many ways to display the trend of a security or index. I like the Candlestick charts and the point and figure (P&F) charts. Each tells a story in a different manner and sometimes may not be relaying the same story at the same time. A few months ago they were telling a different story. Today, they are both on the same wave length. The long term P&F chart has done good service over the years. The biggest difficulty with the P&F chart is in knowing when to revise the units and the unit reversal criteria. So far the latest units and reversal criteria is working okay. Yes, there is the occasional whip-saw effect but this is seldom. If one were expecting perfection one would not be in the securities industry, would one? The whole trick is to get in when a trend starts, stay in as the trend continues and get out when the trend ends. Sounds simple, eh! (that’s Canadian speak, so I’m told).
Some personal views on gold and gold stocks, and markets:
Forget about hoarding a few ounces of gold as a protection against currency disruptions or purchasing loss due to inflation or whatever the industry is selling you. From a long term standpoint you could be dead before it does you any good. You are far better off watching the trend in gold or gold stocks and getting in on the trend and GETTING OUT when the trend is over.
Neither gold nor gold stocks are suitable as “INVESTMENTS”. They are, however, great as speculative vehicles. As such you are not looking at long term trends to invest but at intermediate or short term trends to speculate. For this, in my view, the technical discipline is your best bet to develop speculating or trading tactics.
You must have heard the saying, “you cannot time the market” a hundred times. They are right. You cannot time the market if you are using the fundamental discipline, and almost all of the “experts” who cannot time the market are fundamentalists. Yes, there are technicians that cannot time the market but most of them can.
I have been following gold stocks for many years and developed several gold and silver sector Indices (you see these in the Weekly Table at the end of these commentaries). Over bull and bear markets what comes out from these Indices is that during a bear market BOTH the “quality” and the speculative stocks decline about the same percentage amount. During a bull market, although the “quality” stocks get going first, the speculative stocks soon take over and provide multiple times the gains that the “quality” stocks end up giving you. So, the question is always “why go for the quality stocks?”
There are many experienced speculators (and manipulators) in the gold and silver stock industry. They are in it for the money (as you should be). Their trading (or manipulation) is seen on the charts and picked up by various technical techniques. They are the ones who determine when the bull trend will start and when it will end, especially for the more speculative stocks with nothing much behind them. You can do a lot worse than to follow their activities BUT remember to get out fast when the charts indicate their activities are now on the down side.
Gold and gold stocks can be pretty volatile at times. Take this into consideration when trading in stocks or futures.
Do not get suckered in by stories. There are hundreds of stories and thousands of disappointed gamblers (most of who claimed to be “investors”). You remember Bre-X? Never forget Bre-X, the hot gold stock of the ‘90s. I recommended Bre-X to my clients in a previous service, at the post stock split price of $0.31. I recommended it be sold at the price of $23.00 a year and a half later. Those that went with a “story” saw the price drop to zero about 6 months later. My recommendations were no big deal, they were based purely upon the most simplest of technical techniques. The lesson here was, do not fight the chart trend, regardless of what the story is.
There is always the temptation to get in on the next Bre-X at the very beginning. Check the charts and go only with the trend, and get out when the trend ends. In the gold mining industry there will always be stories of potential fabulous gold finds. If you miss one, another story will soon follow. You wouldn’t have to wait long.
If you are in the market for any length of time one thing is almost a certainty. You WILL lose sooner or later. No one, to my knowledge, lasts very long without coming up to a losing trade. It’s how you handle those losers that separates the men from the boys.
But back to the present charts and indicators. As mentioned above, the long term P&F chart is bullish. As for the normal indicators, well the long term indicators are also bullish. Gold is above its positive moving average line and the momentum indicator remains in its positive zone above its positive trigger line. About the only indicator not positive yet is the volume indicator. It remains in a lateral path just below its negative trigger line. All in all, the long term rating remains BULLISH.
INTERMEDIATE TERM
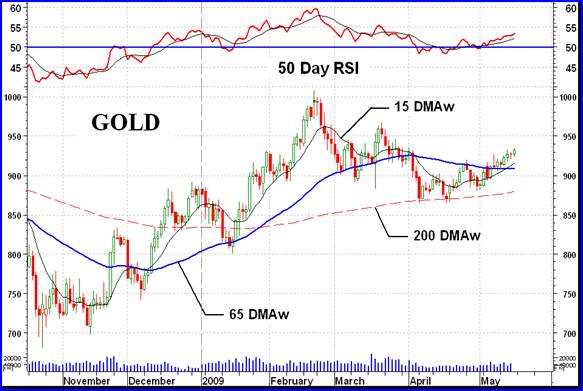
On the intermediate term everything is on the right side but not enthusiastically so. Gold continues to move higher above its positive moving average line and the momentum indicator continues to move higher in its positive zone above its positive trigger line. Even the volume indicator is positive on the intermediate term. Another bright spot is the short term moving average line just having crossed above the intermediate term line for a confirmation of trend. All I can say is that the intermediate term rating is BULLISH.
SHORT TERM
The short term, like the intermediate term, is trending higher and higher. The price of gold continues to move ever higher although in small steps. It is above its positive moving average line. The momentum indicator remains in its positive zone above its positive trigger line. Only the daily volume action gives one a little concern. It is not at the level of previous upward trending days. Despite the somewhat lazy volume numbers the short term rating remains BULLISH.
As for the direction of least resistance, that remains to the up side although the Stochastic Oscillator has entered its overbought zone and seems to be leveling off, possibly in anticipation of a reversal ahead. For now the up side does continue to look the most likely.
SILVER
Silver seems to be having a problem. It has hit that $14.00 level (give or take a few pennies) on four previous occasions and reacted lower. It’s got to go through that barrier with strength or else it may go into another reaction into lower levels. For now it does look like a topping process on-going. A close below $13.68 would confirm a top and lower levels ahead. The aggressive Stochastic Oscillator has already moved into its negative zone and heading lower below its negative trigger line. For now all bets are of as far as continued upside movement is concerned.
PRECIOUS METAL STOCKS
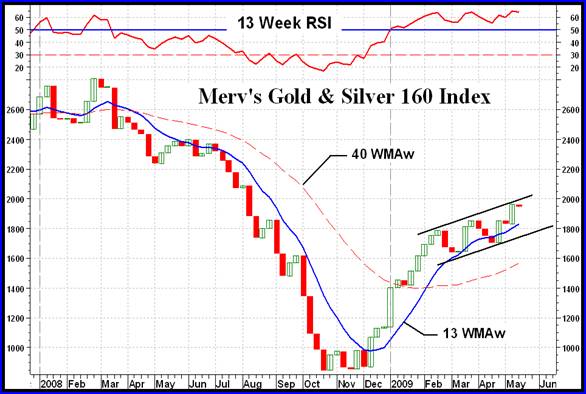
Shown here is the Merv’s Gold & Silver 160 Index representing the average performance of my universe of 160 gold and silver stocks.
Unfortunately I do not have the Weekly Indices Table this week due to unavailable data for some of the Indices. However, looking through the various Merv’s Indices one thing jumps out at you. All of the Merv’s Indices (except for the Gamb-Gold Index) have been trapped in an upward sloping channel for many weeks now (see the chart). Over the past week they have all been butting their values up against the upper (resistance) trend line. What that means most of the time is a reaction to the down side towards the lower support trend line. So, if the next week or three are down weeks do not be too perturbed as this would be a normal reaction during a bull market. Unfortunately, these upward sloping channels have a habit of turning into a trend reversal so if we do get some downside activity, such activity will have to be watched just to make sure it’s not a reversal type rather than a rest period type. As for the Gamb-Gold Index, it has been trapped in a lateral channel rather than an up trending one.
Other than the fact that the various Indices are at the top of a channel pattern, their ratings remain BULLISH for both the intermediate and long term.
Merv’s Precious Metals Indices Table
As mentioned elsewhere, I do not have this table available this week. Hopefully the problem of data acquisition will be solved before next week.
MERV’S GOLD & SILVER 100 INDEX TABLE
I don’t usually post the Merv’s Gold & Silver 100 Index Table, even to my subscribers, as it is redundant. The 160 Table covers all the stocks included in the 100Table plus 60 others.
The Merv’s Gold & Silver 100 Index Table includes the technical information and ratings for the top 100 gold and silver stocks traded on the North American markets, based upon market value. I have just finished revising the table (it gets revised periodically).
I will be posting this latest revision on my uranium blog sometimes during the coming week for all who are interested to view. Check out the blog at http://techuranium.blogspot.com .
It is always possible that I may have missed a gold or silver stock that should be in this Index. I would appreciate if you would let me know and I will look it over and revise the Index if appropriate. You may contact me at mervburak@gmail.com.
That’s it for another week.
By Merv Burak, CMT
Hudson Aero/Systems Inc.
Technical Information Group
for Merv's Precious Metals Central
For DAILY Uranium stock commentary and WEEKLY Uranium market update check out my new Technically Uranium with Merv blog at http://techuranium.blogspot.com .
During the day Merv practices his engineering profession as a Consulting Aerospace Engineer. Once the sun goes down and night descends upon the earth Merv dons his other hat as a Chartered Market Technician ( CMT ) and tries to decipher what's going on in the securities markets. As an underground surveyor in the gold mines of Canada 's Northwest Territories in his youth, Merv has a soft spot for the gold industry and has developed several Gold Indices reflecting different aspects of the industry. As a basically lazy individual Merv's driving focus is to KEEP IT SIMPLE .
To find out more about Merv's various Gold Indices and component stocks, please visit http://preciousmetalscentral.com . There you will find samples of the Indices and their component stocks plus other publications of interest to gold investors.
Before you invest, Always check your market timing with a Qualified Professional Market Technician
Merv Burak Archive |
© 2005-2022 http://www.MarketOracle.co.uk - The Market Oracle is a FREE Daily Financial Markets Analysis & Forecasting online publication.