


Gold, Stocks. Financial Crash Anniversary and the 10-year Cycle Peak
Stock-Markets / Cycles Analysis Sep 10, 2009 - 12:49 AM GMTBy: Clif_Droke

 Talk is now circulating in financial quarters of a new “mini-bubble” in the making. Apparently the unbounded rise in the stock market is reviving fears of another collapse like the one suffered last year.
Another reason that the “hated rally” has sparked fears is that we’re about a year removed from the final “hard down” phase of last year’s 6-year cycle collapse. September 2008 witnessed the financial markets crater and the intensity of last year’s fear was unmatched in our lifetime. Not even the 1972-74 bear market, which was the worst since the Great Depression, witnessed a comparable level of fear.
W.D. Gann used to emphasize the importance of anniversary dates when it came to financial market analysis. The 1-year anniversary of an important market event is by far the most pivotal such date since the collective memory of the investing public is rather limited. Most market participants can still vividly recall the “great unwinding” of September-November last year. The vividness of that primal fear is still strong, hence the reason for the widespread expectation of another crash.
What most investors don’t realize is that the cyclical forces responsible for last year’s debacle are the complete opposite of this year’s. Instead of a bottoming 6-year cycle, the new 6-year cycle that began last fall is up and supportive of the broad market. Even more poignant is the fact that the 10-year cycle is currently in its final “hard up” ascending phase. More than any other factor, this is the reason behind the strong recovery rally of recent months.
Another factor behind the public’s timidity is the economy. Consumer spending took a sizable hit this year in an “echo” effect of last year’s financial market turmoil. While there is no denying the financial turmoil of 2008 has no parallel in recent history, a comparison can nonetheless be made between the 1994-95 experience and the 2008-09 episode. In ’94 the 10-year cycle was in its final “hard down” phase and stocks were in a mini-bear market. Economic activity was at a low ebb in some sectors of the economy and pessimism was everywhere evident.
In ’95 a new 10-year cycle was in force and stock prices rallied non-stop all year. Yet instead of seeing widespread participation, investors mostly stayed on the sidelines and never got a piece of that year’s relentless bull market. Investor advisory sentiment was at its most negative in years and by the end of 1995 talk of a stock market crash was pervasive (sound familiar?) What’s even more instructive is that the recovery rally of 1995 preceded an economic recovery the following year. Whereas the labor market at that time was soft and apartment vacancies were relatively high in many East Coast metro areas, the year 1996 saw the beginning of a recovery that began in the financial sector and extended into the general economy. Here again we see how the stock market always foresees economic reversals well in advance of the government’s statistics.
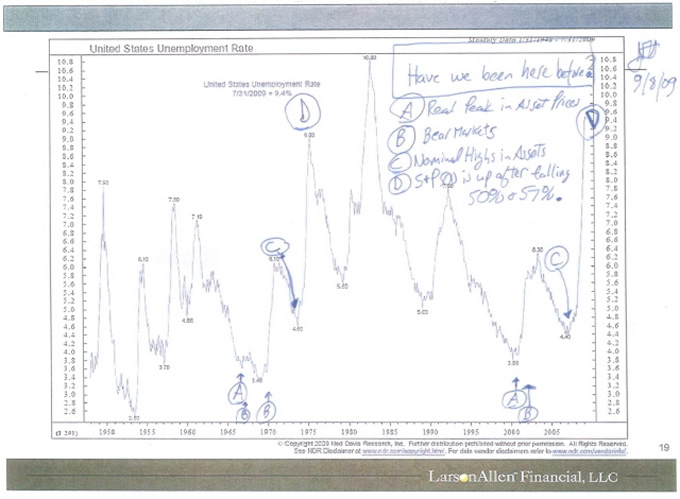
The public was almost a year behind the curve in the 1995 recovery. Investors finally bought into the recovery in ’96 and they’ll eventually respond to the recovery of ’09, as surely as the pessimism of ’09 is a carryover reaction from last year’s crisis. As one proof of that observation we offer as evidence a chart from Ned Davis Research as annotated by a colleague. He presciently observes that stock prices typically peak out when the unemployment rate is at low ebb, as was the case in the mid-to-late 1960s and late 1990s. The unemployment rate typically spikes at major market bottoms, as was the case in 1974-75 when the 40-year cycle bottomed and stocks ended a horrendous bear market and also in 1982 just as stocks were coming out of the ’81-’82 bear market. A similar spike in unemployment was witnessed between 2008 and 2009 as the previous bear market was concluding.
W.D. Gann was correct to attach importance to anniversary dates and he was familiar with the “echo” effect of the investing public’s psyche in response to major market events. The intense fear of 2008 has been gradually eroding all year and while a measure of fear is still discernable today, it will be eventually replaced by something akin to enthusiasm at the next major top.
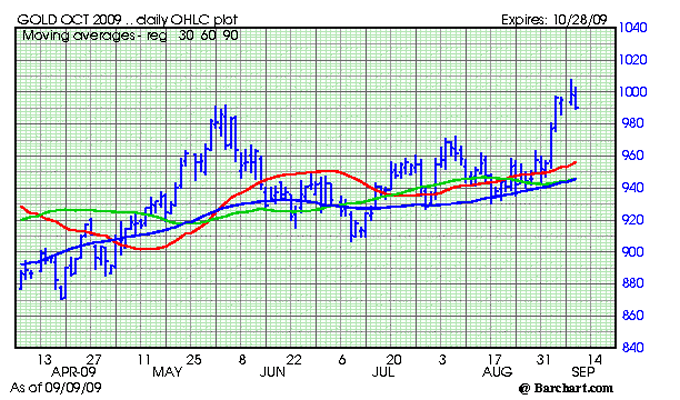
If you needed further evidence of the effects of the peaking 10-year cycle this month, the price of gold should suffice. In a recent newsletter we discussed the possibility that investors would flock to gold in September as the 10-year cycle peaks, just as they did in September 1999 during the previous 10-year peak. It appears that this is just what they did based on the action of early September
The last time the 10-year cycle peaked in September 1999 also saw a huge upward spike in the gold price. In late September ’99 the gold price went from about $255 to around $325 as the 10-year cycle peaked. This reflected a run into gold by investors over fear generated by the decline in the stock market that began in July that year and culminated in October.
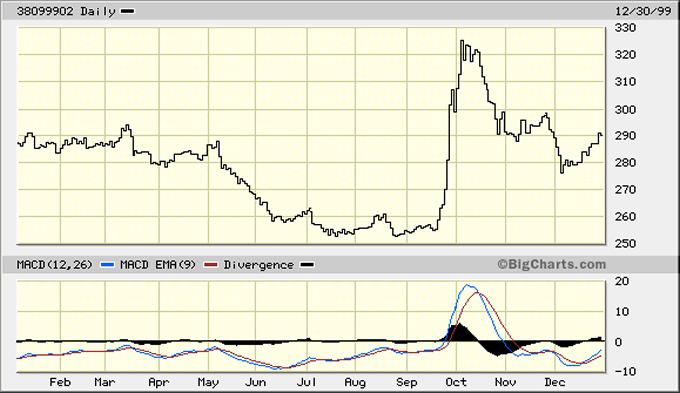
In this regard the gold price can be viewed as a surrogate Volatility Index, which in turn measures investor fear. Heightened fears over China’s economic outlook, coupled with concerns over the U.S. governments ability to keep the recovery going, has led to the latest rush into gold. This is in some ways similar to the September 1999 situation in that saw the gold price spike as investors reacted to the July-September correction in the stock market. Stocks found bottom shortly after the 10-year cycle peaked and the gold price reversed lower at the same time. But for a while it was gold that enjoyed the benefit of the final peak phase of the 10-year cycle in ’99 and it looks like this September’s 10-year cycle peak will also be good to the gold price.
Just as gold and silver were among the first to benefit from the bottom of the 6-year cycle last fall (in fact they led the stock market out of the doldrums), it makes sense that they are among the biggest beneficiaries of the peaking 10-year cycle this month, much as they were in September ’99 during the previous 10-year peak.
In total contrast to last September, producers are more optimistic about the future outlook for the yellow metal. Speaking to the heads of several junior and mid-tier mines, I get the sense that producer sentiment has done a complete about-face from the year-ago period. Dr. Diane Garrett, President and CEO of Romarco Minerals, told me, “I’ve learned watching gold over the years that it’s very difficult to predict the price of gold because there are so many factors that weigh into it. But what I can tell you is that I’m very bullish on gold, very optimistic. When you look at a lot of the different things going on in the U.S. with the economy, with the deficit, with a number of things it fares very well for a strong gold market. I’d think an average of $1,000 an ounce is very realistic even to reach that target before the end of this year. I certainly think that $1,200 to $1,400 an ounce gold is very realistic over the next two to three years.”
When asked where he saw the future prices of gold and copper, Abacus Mining’s Chairman and CEO Doug Fulcher said, “I believe we’ll see a solid copper price in the $2.50 to $3.00 range for the next 10 years. I think gold, we’ve seen it stay very solid through this economic tsunami that we’ve gone through. Gold is trading at $950 today; copper is trading at $2.50. We’ve gone through hell in the market and hell in the world from the economy standpoint and yet these metals are still staying high in price. With the economic stimulus packages that are being put in around the world I can’t see copper dropping. I just see the need for copper.”
Concerning gold he added, “The other thing is that in downturns no one goes out and does exploration. How many new producing copper mines have there been? Not that many. How many are ready to come on stream? There are a lot but still, we’re looking at 2012, 2013, 2015 before these are coming back on stream. I’m optimistic about base metals prices but also I believe we’re going to see north of $1,000 gold. I don’t think know if I believe in $2,000 or $3,000 gold and I don’t if we really want that. I think we’re comfortable where we are around $1,000 gold and I think we’re seeing good operations come back into production and enhancing production with these metal prices we’re seeing right now.”
John Huguet, Andean American’s Chairman and CEO told me, “I see further devaluation of the U.S. dollar and anything priced in dollars will go up as a consequence. I’ve been around long enough to know that metals markets are volatile, however…. Copper prices are also very attractive, lead prices are attractive. To see prices like this brings tremendous economic value to the forefront very quickly.”
Endeavour Silver’s Chairman and CEO, Bradford Cooke, was quite bullish on where he sees gold and silver prices headed: “I feel the precious metals by their very natures are separate and distinct from other metals. There’s no question gold and silver will exhibit leadership as the commodities cycle resumes its march forward and inflation raises ugly head. Everything moves in cycles but we are optimistic about the future of the metals. That gold and silver price has tremendous opportunities for gains going forward. When prices finally peak there is a risk of a bubble at the top of these markets. Gold could run two-to-three thousand dollars. We could see $25 to $50 silver. I consider myself a modest bull. Long-term, the sustainable prices of these metals in U.S. dollar terms will be significantly higher than current prices.”
By Clif Droke
www.clifdroke.com
Clif Droke is the editor of the daily Gold & Silver Stock Report. Published daily since 2002, the report provides forecasts and analysis of the leading gold, silver, uranium and energy stocks from a short-term technical standpoint. He is also the author of numerous books, including 'How to Read Chart Patterns for Greater Profits.' For more information visit www.clifdroke.com
Clif Droke Archive |
© 2005-2022 http://www.MarketOracle.co.uk - The Market Oracle is a FREE Daily Financial Markets Analysis & Forecasting online publication.