


Financial Market Meltdowns, Inflation, Protecting Capital and Trading Commodities
Stock-Markets / Financial Markets 2010 Jan 11, 2010 - 01:57 AM GMTBy: Chris_Vermeulen

 The purpose in owning commodities like gold, silver and oil is to protect oneself from the effect of inflation that I believe will begin to assert itself in the coming months.
Unfortunately, the United States has taken a monetary policy of printing massive amounts of money to attempt an escape of deflation. In just the past 16 months, the monetary base has ballooned from $908 billion to $2.0 trillion. Bailout funds in the past 2 years total $8.1 trillion..... That is 78 times more than what they spent to bail out WorldCom...... and 123 times more than they spent on Enron. U.S. debt has risen sharply, from $6.2 trillion in 2002 to $12.1 trillion today. These are scary numbers!
The illusion of economic recovery in the U.S. is simply the function of the FED making billions and trillions of newly printed money available at literally ZERO percent interest to the largest financial institutions. The idea that you really can get something for nothing is fantasy. But that’s what’s happening - Money created out of thin air, instead of created by PRODUCTION.
A painful reality check will appear when these quantitative easing policies create inflation without employment or productivity gains. Commodities - hard assets - will outperform everything in this type of environment. To some people commodity investments may sound like a no-brainer investment, however without a sound money and risk management system in place there really is no such investment.
This is why I focus on technical analysis as it provides price points for investments when we should be putting our money to work on a weekly or monthly basis. When volatility is rising I put less money to work to protect my portfolio from sharp price movements (risk). And during low volatility I push more money into the market catching trends with lowered risks.
What really blows my mind is how almost everyone I know who employed a broker or financial advisor lost between 30-70% of their portfolios during the market crash. What the heck was everyone paying for?
What I am trying to say is everyone can make money in a bull market. The question is, do either you or your financial advisor know when to take some profits to lower overall risk? How much money will you give back when the market corrects, starts another bear market or is affected by a terrorist attack? Do you have protective stops in place?
Ok, that’s enough of that; let’s get to the charts…
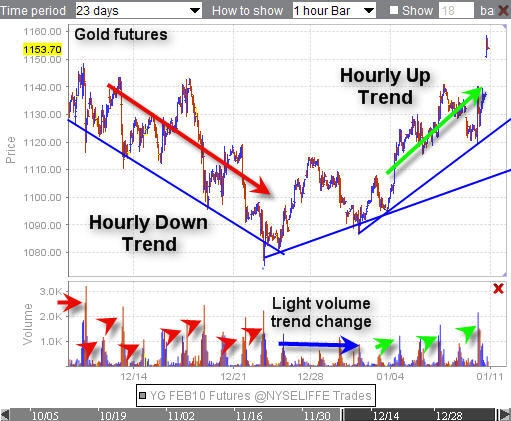
Gold Futures Trading – Hour Chart
The gold futures chart allows for us to trade prices around the clock 23 hours a day. A lot of important price patterns are analyzed from the over night trading hours which helps to provide low risk and high probability setups for the GLD gold fund.
This hour chart shows about 3 times more trading data on gold than the GLD etf. Using this data we know if gold will be gapping higher or lower the next day and if the price is trading near a support or resistance level, etc… I focus on selling short gold at resistance levels in a down trend and buying dips during up trends.
The futures trading volume is very interesting to look at. The selling volume was more than twice what we are seeing for this bounce/rally. A low volume rally/bounce is not exactly what we want to see for a move higher. I have my doubts about this being THE NEXT LEG HIGHER, but let’s watch it unfold.
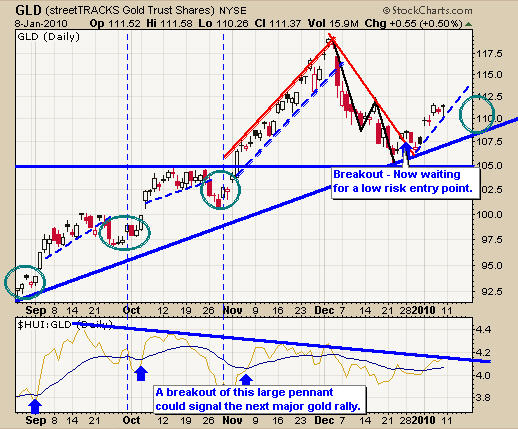
GLD Gold ETF Trading – Daily Chart
Trading just the US market sessions does limit the trading opportunities. When commodity etf’s open each day they tend to gap up or down as the overnight trading move the price. To most traders GLD is an ugly looking chart because of its tendency to gap up and down each day. But when you focus on the gold futures charts for trend and price pattern analysis things become very clear.
Gold is moving higher currently and I am waiting for a low risk entry point before jumping on board. I don’t chase prices higher unless there is a lot of excitement in the air with lots of momentum to back up the higher risk play and, I do not feel this is a time to panic and buy gold.
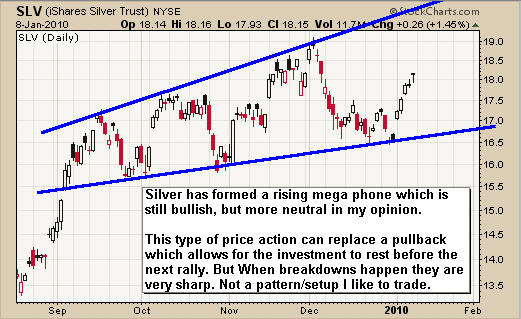
SLV Silver Exchange Trade Fund – Daily Chart
Silver has had a nice pop and I thing it will out perform gold when the time comes. But this upward slanted mega phone pattern is not what I like to trade. While it is still bullish, it’s close to a neutral pattern and breakdowns from this can be fast and painful if you do not have a protective stop in place.
It’s looking a little long in the teeth for this bounce so I am waiting to see what happens over the next few days.
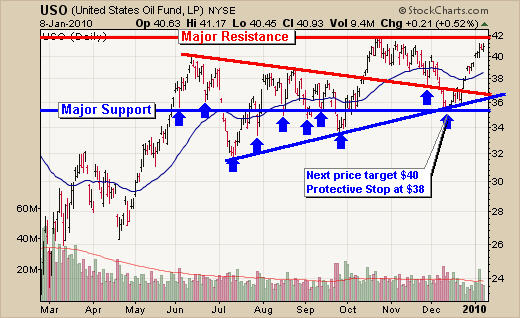
Crude Oil USO Fund – Daily Chart
Oil has had a great bounce off of a major support level back in December. Oil is now testing its October highs. It will take a few weeks for a new setup to form in oil as buying here carries about 15% downside risk.
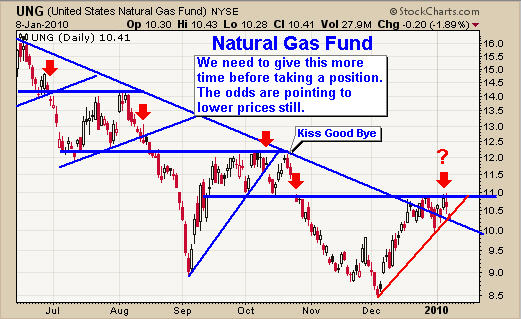
Natural Gas UNG Fund – Daily Chart
Last weekend I got together with my buddy who is a futures broker in Toronto. We spent a bunch of time going over some charts, swapping thoughts, ideas strategies etc…
Anyways he said a ton of people are opening futures accounts and wanting to trade natural gas. He said that is a suicidal thing to do and that almost everyone who opens an account to trade natural gas loses all their money within 3 months. Natural gas is one commodity you need to have a solid trading strategy along with strict risk and money management.
Natural gas on the UNG chart looks like a possible short play. But let’s wait and see how things unfold this week.
Gold, Silver, Oil & Nat Gas Trading Conclusion:
Trading and investing with technical analysis allows us to assess the current market volatility and trends. Understanding these things will help protect your hard earned money.
It looks like 2010 will be a fantastic year for trading!
To Your Financial Success,
By Chris Vermeulen
Chris@TheGoldAndOilGuy.com
Please visit my website for more information. http://www.TheGoldAndOilGuy.com
Chris Vermeulen is Founder of the popular trading site TheGoldAndOilGuy.com. There he shares his highly successful, low-risk trading method. For 6 years Chris has been a leader in teaching others to skillfully trade in gold, oil, and silver in both bull and bear markets. Subscribers to his service depend on Chris' uniquely consistent investment opportunities that carry exceptionally low risk and high return.
This article is intended solely for information purposes. The opinions are those of the author only. Please conduct further research and consult your financial advisor before making any investment/trading decision. No responsibility can be accepted for losses that may result as a consequence of trading on the basis of this analysis.
Chris Vermeulen Archive |
© 2005-2022 http://www.MarketOracle.co.uk - The Market Oracle is a FREE Daily Financial Markets Analysis & Forecasting online publication.