


Indian Stock Market Outlook
Stock-Markets / India Apr 04, 2010 - 01:41 PM GMTBy: StocksBuddy

 Detailed Technical Analysis with Chart studies from IndianStockCharts.com
Last Week Nifty made a new high, but barely closed above previous weeks close. The bullishness continued throughout the week with just a couple sessions in red. All the indicators have been in Overbought territory for a while now. This has been the case for almost all of the world indices.
There has been some divergences seen in other parts of the world. While Shanghai index was breaking out last week, other world indices were relatively flat-to-positive.
Technically Speaking:
Take a look at the Daily Nifty chart below.
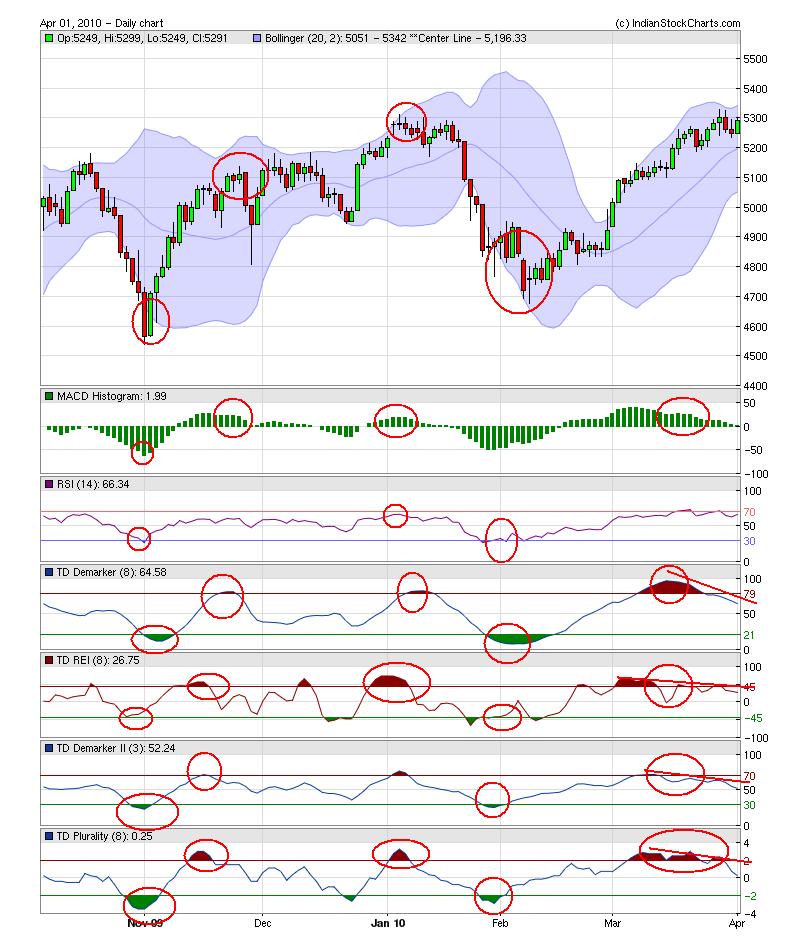
The above chart uses TD Demark indicators extensively.
Positives:
- RSI Extremely strong and is above 50.
- Nifty is close to its 52 week highs. Momentum is excellent.
- MACD histogram still in positive territory.
- Bollinger Bands still extremely Strong.
Negatives:
- All of the indicators have negative divergences.
- Take a look at the circles on the chart carefully. Each time ALL the TD demark indicators moved below their overbought levels, Nifty made a top. Likewise, when each time ALL the TD demark indicators moved UP from their oversold levels, Nifty made a bottom. At this time we have an overextended TD indicators that are clearly moving down.
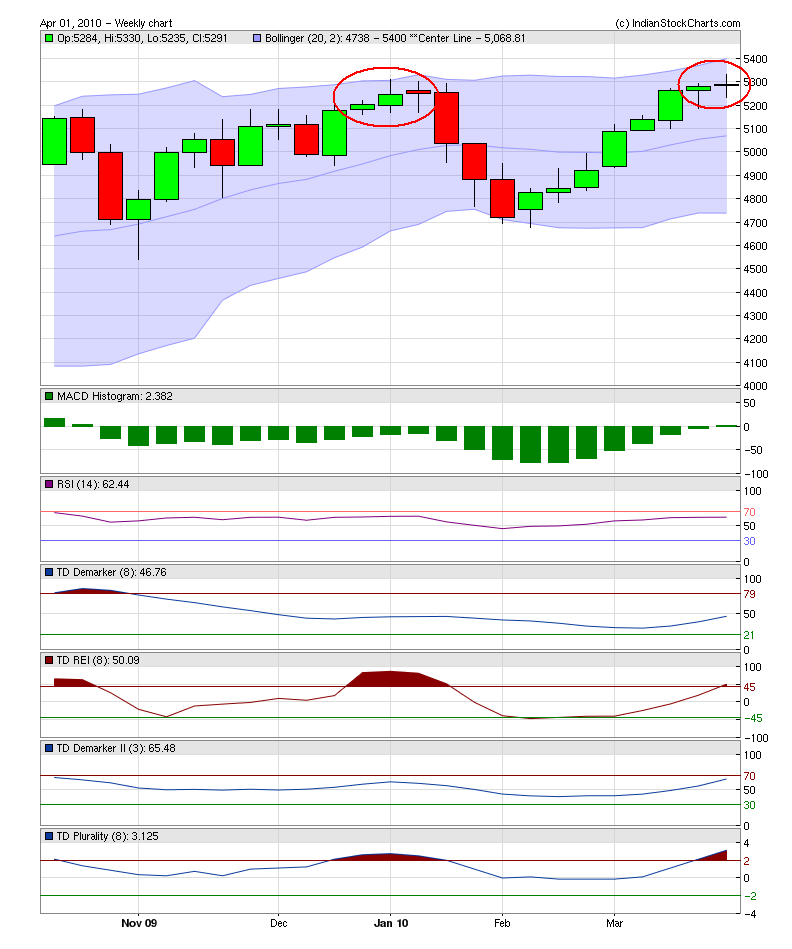
- Take a look at the weekly chart below. There are similarities in the candlesticks formed just around previous top in January. Does that mean we are now at a confirmed top?
Next Week:
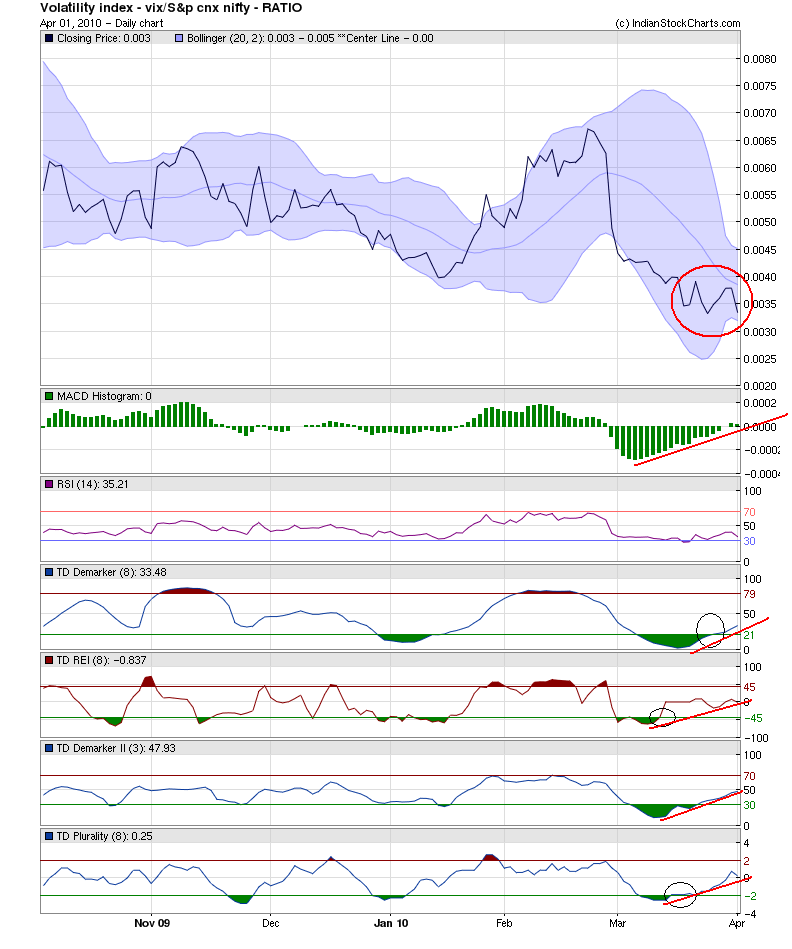
The beauty of technical Analysis and Charts is that they tell you almost everything that can potentially happen. It is however left to interpretation as to what and how you perceive it. Before we can come up with a conclusion for what we can expect in this coming week, let us see one last chart.
The chart below is the ratio chart of Indian VIX (Volatility index) to Nifty. This chart shows the correlation between Volatility and the moves in Nifty. The lower this chart, the higher the chances for Nifty to move up and vice-versa. If you however look closely to the TD demark and other indicators, all of them are either moving up or are having positive divergences. Also if you notice, the ratio is kind of stuck and hasn’t really continued it’s descent. The slow-down of such descent may indicate a potential reversal. And if it does, that would signify increase in volatility and top in Nifty.
Are we there yet? Not yet sure.
We always need a confirmation of trend. At this time we do NOT have a negative confirmation. Hence, the action plan for next week is to continue being bullish and trade with extremely TIGHT stops. If we have a spike in Vix the alters this ratio chart above, then exit all longs immediately.
Do NOT initiate Short positions yet. Wait for trend change and you will have lot of time to go short.
Have a Wonderful Trading Week ahead.
Regards
India's No.1 Trading Community From the desk of StocksBuddy.com Analysts comes the above article. SB Analyst team comprises of experts from varied fields such as Technical Analysis, Fundamental Analysis, Macro-Micro Economics, World Affairs, Currency and much more. Apart from user contributions, our analysts post analysis on StocksBuddy.com on a regular basis. For more details, please visit us @ http://www.stocksbuddy.com/blogs
© 2009 Copyright StocksBuddy - All Rights ReservedDisclaimer: The above is a matter of opinion provided for general information purposes only and is not intended as investment advice. Information and analysis above are derived from sources and utilising methods believed to be reliable, but we cannot accept responsibility for any losses you may incur as a result of this analysis. Individuals should consult with their personal financial advisors.
© 2005-2022 http://www.MarketOracle.co.uk - The Market Oracle is a FREE Daily Financial Markets Analysis & Forecasting online publication.