


Is It Time To Short The S&P500
Stock-Markets / Stock Markets 2010 Apr 14, 2010 - 10:59 AM GMTBy: Guy_Lerner

 A real headwind for the markets -now and in the past - has been when the trends of gold, crude oil, and yields on the 10 year Treasury are strong and rising.
Figure 1 is a weekly chart of the S&P500 showing the composite indicator constructed from the trends in gold, crude oil and yields on the 10 year Treasury, and the indicator has been in the extreme zone for 6 weeks now, yet the S&P500 has risen about 5.5% over this time period.
Figure 1. S&P500/ weekly
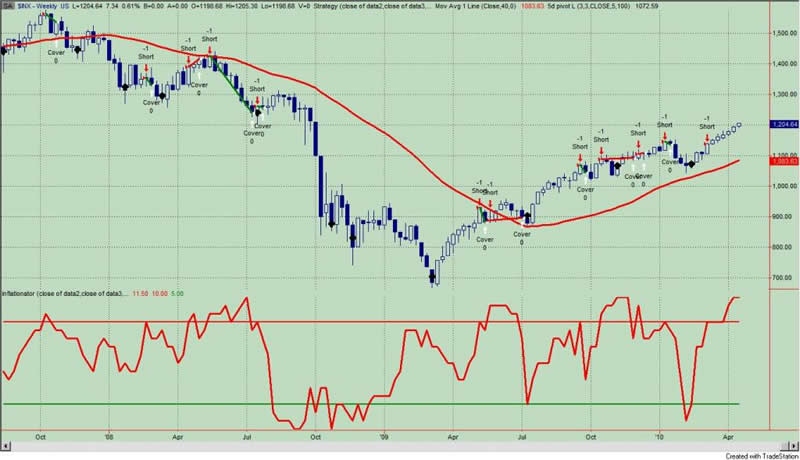
So is this another one of those broken indicators that doesn't work because "those things don't matter anymore"? Actually, if we design a study where we short the S&P500 only during those times when the indicator is in the extreme zone - as it is now- you would get the sell short (entry) and cover signals (exit) shown in figure 1. More specifically, such a strategy would produce a maximum adverse excursion (MAE) graph, which is shown in figure 2, and what we find from this graph is that the current trade, which has gone 5.5% adverse to its entry point, remains within the limits of prior trades.
Figure 2. MAE Graph
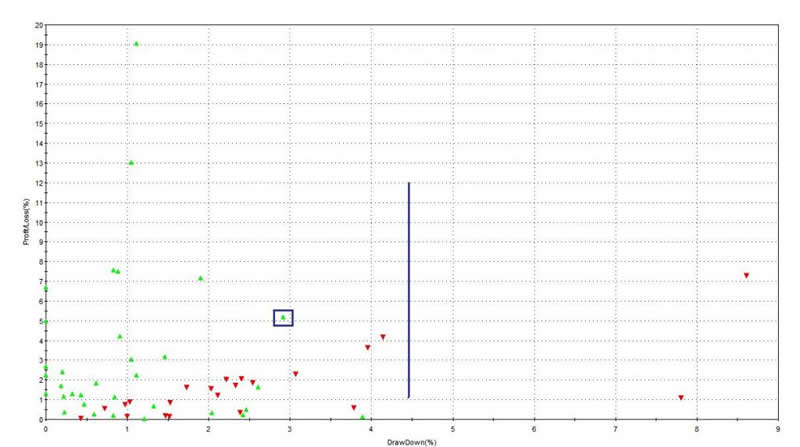
As we know, the MAE graph assesses each trade from the strategy and determines how much a trade had to lose in percentage terms before being closed out for a winner or loser. You put on a trade and if you are like most traders, the position will move against you. MAE measures how much you have to angst and squirm while you are in that position. As an example, look at the caret in figure 2 with the blue box around it. This one trade lost 3% (x-axis) before being closed out for a 5% winner (y-axis). We know this was a winning trade because it is a green caret. Now if you shorted the S&P500 6 weeks ago when the indicator became extreme, then the current MAE is about 5.5%. In other words, this trade is underwater. Since 1984, there have been 55 trades from this strategy and this is the third most extreme MAE. In other words, almost 95% of the trades from this strategy had an MAE less than 4.5% and this is to the left of the blue line in figure 2. So the current MAE is extreme.
How can we use this information? First, the basis for the trade remains sound. I tend not to rationalize the data and nor do I see any reason to do so now. Second, the MAE, while extreme, is still within the limits of prior extremes from this strategy. Third, one of those extremes recovered to be closed out for a 1% loss while the other extreme MAE did not recover.
So I look at this data and think that this might be a low risk time to bet against the S&P500. The current trade has already made an extreme, adverse move. There is no reason to think that the premise of strong trends in crude oil, gold, and yields on the 10 year Treasury has lost its effectiveness of identifying market headwinds. Think about it this way: you could have shorted the market 6 weeks ago, which means you would be incurring that 5.5% draw down. The trade made 6 weeks ago may recover but it is unlikely to be profitable. The trade made today will likely be profitable or incur minor losses before being closed out. This is what the MAE graph suggests.
In the ARL Advisers' Real Time Portfolio, I am long the Ultra Short S&P500 ProShares (symbol: SDS), and this is a 2x ETF that bets against the S&P500.
By Guy Lerner
http://thetechnicaltakedotcom.blogspot.com/
Guy M. Lerner, MD is the founder of ARL Advisers, LLC and managing partner of ARL Investment Partners, L.P. Dr. Lerner utilizes a research driven approach to determine those factors which lead to sustainable moves in the markets. He has developed many proprietary tools and trading models in his quest to outperform. Over the past four years, Lerner has shared his innovative approach with the readers of RealMoney.com and TheStreet.com as a featured columnist. He has been a regular guest on the Money Man Radio Show, DEX-TV, routinely published in the some of the most widely-read financial publications and has been a marquee speaker at financial seminars around the world.
© 2010 Copyright Guy Lerner - All Rights Reserved
Disclaimer: The above is a matter of opinion provided for general information purposes only and is not intended as investment advice. Information and analysis above are derived from sources and utilising methods believed to be reliable, but we cannot accept responsibility for any losses you may incur as a result of this analysis. Individuals should consult with their personal financial advisors.
Guy Lerner Archive |
© 2005-2022 http://www.MarketOracle.co.uk - The Market Oracle is a FREE Daily Financial Markets Analysis & Forecasting online publication.