


Is the Gold Price Rally Based on Any Reality?
Commodities / Gold and Silver 2010 Aug 15, 2010 - 05:05 PM GMTBy: Merv_Burak

 A small rise in the price of gold this past week continues to get a rise out of the speculators but is it based upon any reality? Are the market action and the fundamentals in sync? I don’t know about the fundamentals but here you get a feel for market action.
GOLD : LONG TERM
Nothing much changes from week to week. Only occasionally does anything serious happen to the long term indicators. So it is this week, nothing much happening. The price of gold may have moved higher this past week but with the price already above its positive sloping moving average line that was a non-event. The long term momentum indicator continues to move inside its positive zone, where it has been since early Jan of 2009. The indicator has already given us a negative divergence versus the price action at its recent highs in June. This warning of a weakening in the strength of recent upside action does not mean that a reversal of long term trend is immediate but does warn that should this weakening continue then the only logical direction for the price, somewhere down the line, is to the down side. We do need to see a strengthening in the momentum of upside moves. As for the volume indicator, it has been showing strength having entered new highs recently and continues to trend above its positive trigger line. We seem to have a difference of opinion between the momentum and volume indicators. Following a significant long term move any topping in the actions of price and weakening in the momentum indicator is very often overlooked by the volume indicator for some time. Too often the volume indicator is a lagging indicator at market tops. I would pay great attention to it at market bottoms but not necessarily at market tops. So, what we still have is a long term BULLISH rating for the price of gold.
INTERMEDIATE TERM
Over the past few months the price of gold has really gone no place. This is now resulting in the intermediate term price and indicators to start criss-crossing resulting in whip-saw effects. This past week gold has crossed above its moving average line and the line itself turned very slightly to the up side on Thursday, where it remains. The momentum indicator which was for a short period in the negative zone is once more in the positive zone and moving higher above its positive sloping trigger line. Despite the move into its positive zone the momentum indicator is not showing any extra strength that would suggest a prolonged upside move. Something to keep an eye on. As for the volume indicator, it seems to be in a topping process but remains above its positive sloping trigger line. The combination of indicators results in a BULLISH intermediate term rating but it is not a very strong one at the present time. Unfortunately, the short term moving average line has not yet confirmed this rating and remains slightly below the intermediate term line.
SHORT TERM
So many things happening in the short term chart, where, oh where to start.
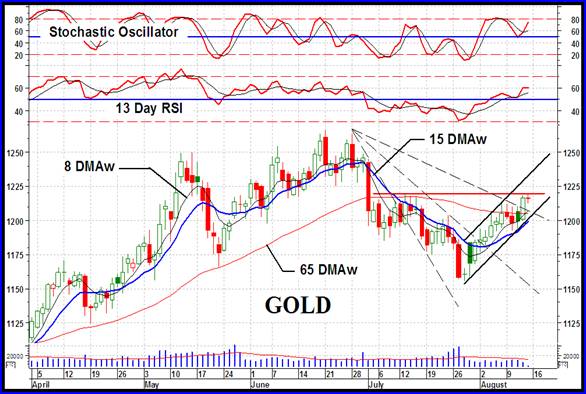
Let’s see, first we have one of my Merv’s Bullish Decelerating Fans. It is bullish because the final result is usually an upside break in the price action. It is decelerating in that each succeeding Fan trend line has a lesser and lesser vertical slope, i.e. the downside is decelerating. The second Fan line is the one that defines a reversal of trend while the third Fan trend line confirms the new trend. We need this confirmation as too often just the breaking of that second Fan trend line is not enough. From my Fan Principle we now have a confirmation of a short term trend reversal to the up side. How high does this portent? That is something that I have been unable to successfully determine but a move back to the apex point (at around the $1263 level) is as good of a guess as any.
Secondly, we have what most technicians would call a reverse head and shoulder pattern. The Friday close is just at the point of breaking above the neckline. Should the price move above the neckline, that would confirm the pattern and project the move into the $1280 area. I don’t like this as an H&S pattern. I have a guideline for the head and shoulder that requires the distance from the low head price to the start of the down trend to be AT LEAST double the distance as from the bottom of the head to the neckline. This we do not have here. It’s just a quirk of mine and nothing I have ever seen in any text books. Also, I would like to see the daily upside volume pick up as the price moves towards the neckline break, and especially during and after the break. We have very low volume action leading to the neckline so we shall just have to see how the volume reacts at the break-out. As a plus, the short term momentum indicator is showing improvement in the strength of the move during the price run towards the neckline.
Thirdly, the recent three week rally has shown itself to be confined within a well defined up trending channel. Friday’s close is basically in the middle of the channel so it could go either way and remain within the confines of the channel.
So, what do our normal indicators have to say for all of this? The price continues moving above the short term moving average, as it has been for some three weeks now. The moving average is well entrenched in an upward trend. The momentum indicator has been improving during this time and is inside its positive zone, above its positive trigger line. Only the daily volume activity leaves a lot to be desired. This continuing low upside volume activity seems to suggest that the volume indicators for the long and intermediate term may be more in topping patterns than in bullish trends. However, putting the short term indicators together gives us a BULLISH rating. The very short term moving average line has been above the short term line for two weeks now continuing to confirm the short term bull.
Now the more difficult assessment. What to expect in the next day or two. My first look is to see if I can spot anything in the actions of the Stochastic Oscillator. It does not always say things. After the Friday close it is in an upward trend BUT it is showing a very short term potential negative divergence. Although the price of gold did move into new rally highs on Thursday and Friday the SO has yet to reach into its new highs. This is often a precursor to a short term rest period or even a short reversal of trend. With the very tight trading range on Friday I would be inclined to think that a reversal is in the cards. For immediate direction I will cop out and go with the lateral although the down side looks very possible.
SILVER
For the past four and a half months silver has been moving in a lateral path, going no where. This raises havoc with intermediate and short term indicators giving a lot of whip-saw effects over time. Until the price decisively breaks out of this lateral drift we will continue to have the price and indicators criss-crossing. The P&F chart suggests that silver remains above a very strong support at the $17.50 level but a move to $17.00 would be cause for great concern. On the up side we have a down trending trend line that would be broken once the price moves to $19.00 but $19.50 would be more encouraging. Until one of these two levels are reached ($17.00 or $19.00) it’s a wait and see game which could go either way.
PRECIOUS METAL STOCKS.
Since the beginning of the year an average precious metal stock (gold and silver) has basically moved sideways. Yes, there are always those few stocks that go counter to the established trend (in this case going either higher or lower) but very few speculators are in those stocks. The vast majority of speculators are sitting with stocks doing nothing or holding cash just waiting for something to get going. I know no one likes to think of themselves as part of the majority but let’s face reality, we are the majority.
The overriding image one gets from a review of the stock Indices is one of a topping process on going. The momentum indicator has been giving us a topping warning for some time now and nothing has happened (yet) to counter that message. We need to see a sharp upward move in the stocks or else the topping activity will end and a downward spiral will take hold.
Merv’s Precious Metals Indices Table
Well, that’s it for another week.
By Merv Burak, CMT
Hudson Aero/Systems Inc.
Technical Information Group
for Merv's Precious Metals Central
For DAILY Uranium stock commentary and WEEKLY Uranium market update check out my new Technically Uranium with Merv blog at http://techuranium.blogspot.com .
During the day Merv practices his engineering profession as a Consulting Aerospace Engineer. Once the sun goes down and night descends upon the earth Merv dons his other hat as a Chartered Market Technician ( CMT ) and tries to decipher what's going on in the securities markets. As an underground surveyor in the gold mines of Canada 's Northwest Territories in his youth, Merv has a soft spot for the gold industry and has developed several Gold Indices reflecting different aspects of the industry. As a basically lazy individual Merv's driving focus is to KEEP IT SIMPLE .
To find out more about Merv's various Gold Indices and component stocks, please visit http://preciousmetalscentral.com . There you will find samples of the Indices and their component stocks plus other publications of interest to gold investors.
Before you invest, Always check your market timing with a Qualified Professional Market Technician
Merv Burak Archive |
© 2005-2022 http://www.MarketOracle.co.uk - The Market Oracle is a FREE Daily Financial Markets Analysis & Forecasting online publication.