


Learn How Butterflies Can Create Profits When Trading Gold GLD ETF
InvestorEducation / Options & Warrants Sep 13, 2010 - 04:21 AM GMTBy: J_W_Jones

 In recent articles, we discussed that Theta (Time Decay) has the potential to cause option prices to decline dramatically, particularly in the final weeks leading up to option expiration. As it turns out, we are now in that very period of time and option strategies that utilize Theta (time) decay as their profit engine can really produce some outstanding risk/reward opportunities. Vertical spreads, butterflies, and iron condors can all be utilized to create profits in this environment, with a crisply defined amount of risk. When risk can be accurately defined, option traders can shape their expected perception of price action around their own unique time frame and risk profile.
I wanted to take this opportunity to illustrate some potential strategies to trade GLD. While futures and equity traders are forced to wait for a breakout or a selloff, option traders have the unique ability to profit from the passage of time. The chart below is the GLD weekly chart.
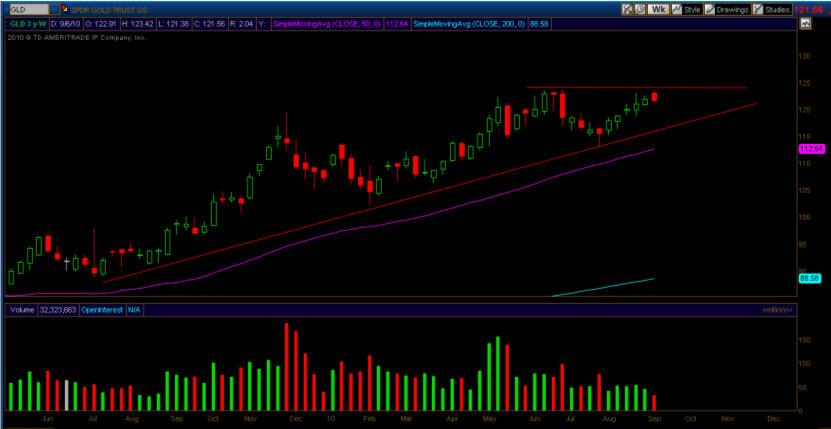
I rarely use weekly charts, but I have had a lot of success in the past using the weekly chart when trading options on the gold and oil ETF’s. Gold is coming into a wedge and I am sure that opinions range far and wide which direction price is headed. As an option trader, it really does not matter too much to me which direction price goes as long as price will stay within a predictable range. Below is the daily chart of the gold ETF, GLD.
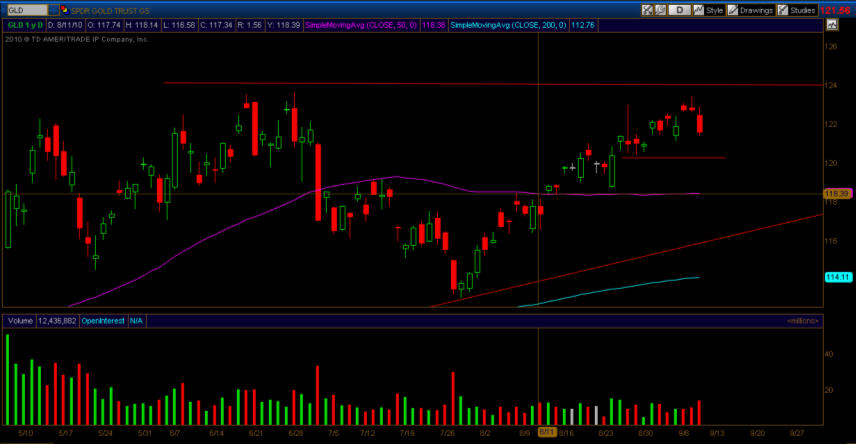
Quite frankly I could care less what gold does over the next year, my focus is on what gold will do in the next six days. One of the unique characteristics of options is the ability to truncate the market exposure to a sharply defined time window. In cases where these wedges present themselves, it usually takes several days before the underlying will tip its hand as to which way price will go. As stated above, we know that options will expire in six trading sessions and we also realize that the chart pattern lends itself for gold to stay within the wedge at least for the next few days. When I look at a chart like this at this point in the option expiration cycle, I am thinking about one thing - THETA DECAY! How can I build a trade that will utilize Theta Decay, and give me a significant opportunity to realize a solid profit while taking a finite amount of risk?
I do not have a directional bias, but I am expecting GLD to consolidate for the next several days before making a break in either direction (the first move is often times the false move.) A basic strategy would be to utilize a call/put credit spread. Based on the chart above, the 124 price level represents some relatively significant overhead resistance. At the same time, the 50 period simple moving average represents a key support level. The chart below illustrates the risk/reward of a call credit spread. The terminology can be confusing since the same trade can often be designated by the same name; in this case, this could also be termed “selling a call vertical” or a “bear call spread.”
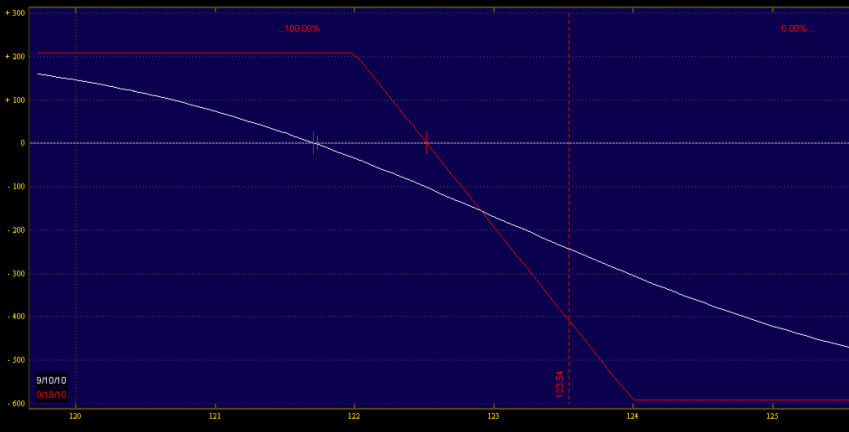
The trade setup involves selling 4 Sept. 122 GLD Calls and simultaneously purchasing 4 Sept. 124 GLD Calls. To make the calculation simple, I am using the Thursday closing prices to illustrate this trade. Obviously the trade would change based on market conditions tomorrow. The maximum risk on this trade is $592 not including commissions. The maximum gain at expiration is around $208 not including commissions. A similar trade could be used for traders expecting gold to rally. The trade would utilize puts instead of calls and would be setup selling the SEPT 121 Puts and buying the SEPT 119 puts.
For our short biased trader, if GLD were to close below $122/share or lower at option expiration, the trader would make the maximum gain of $208 which represents over a 30% gain based on risk. Keep in mind, this trade has a maximum gain of $208, thus if price were to collapse totally the trader would only earn $208. On the flip side, if GLD were to close at $124/share or higher, the trader would lose the entire $592 that they risked. The trader with a long bias would collect the maximum profit if GLD’s price at option expiration closed above $121/share and he/she would sustain the maximum loss if GLD’s price at option expiration was below $119/share.
A successful option trader I know personally refers to this time of the option cycle as “Butterfly Season.” For those of you new to options, butterflies are the nickname of a multi-legged option strategy that traditionally uses Theta Decay (time decay) as its primary profit engine. A butterfly gets its name from the way it is constructed. A traditional butterfly involves purchasing two option contracts at different strike prices with the same option expiration while selling like contracts evenly spaced between the contracts purchased in a combination of 1 /-2/ 1.
Since we are nearing option expiration, butterflies become a very popular choice for experienced option traders because they offer limited risk and give option traders the opportunity to potentially profit from the inevitable time decay that is right around the corner. Theta decay is as inevitable as the passage of the tides; the time value of options goes to 0 at expirations. This decay is not negotiable and occurs each and every options cycle. As you will see shortly, the close proximity to option expiration presents incredible risk/reward setups when butterflies are utilized appropriately. Just as a basic reminder, I am using Thursday’s closing prices to illustrate this trade and obviously market conditions will change during trade tomorrow.
I selected the following setup to construct a butterfly that will profit if price continues to decline or consolidates over the next few days. The setup consists of September GLD puts in the following setup: Long 1 SEPT GLD 116 Put / Short (Sell) 2 SEPT GLD 119 Puts / Long 1 SEPT 122 Put. The trade is placed simultaneously and a trader’s account would be debited a total of $86 dollars to place this trade. For educational purposes, if a trader wanted to take on more risk he/she could increase the size of the butterfly, however to maintain a standard butterfly they must be increased in the ratio of 1 /-2 / 1. So if a trader wanted to risk a total of $860 (10x bigger), they would put the trade on in the ratio 10/-20/10.
Keep in mind that an option butterfly could be constructed using calls with the exact same strikes in the same setup for a similar profit. However, it usually behooves an option trader to chart both contract types to see which contract offers the most profit. Implied volatility can have slight differences based on the broad markets expected price direction of the underlying. For option traders using relatively small butterfly orders this is not a huge difference, for option traders that swing big and wide the slight difference can really add up, particularly for those trading more than 100 contracts per side.
The maximum loss the put butterfly can sustain is $86 per side. So, my original trade of 1/-2 /1 has a maximum loss of $86. The trade will be profitable at option expiration if GLD’s price closes between $116.90/share and $121.10/share. The maximum gain this trade could earn would be an expiration that closed exactly at $119/share. The maximum gain on this trade is around $218. While it is unlikely that GLD will close at exactly $119/share, if it closed near that price level, the trader would realize well over a 100% return based on the capital they risked. The chart below illustrates the profitability of our GLD butterfly position.
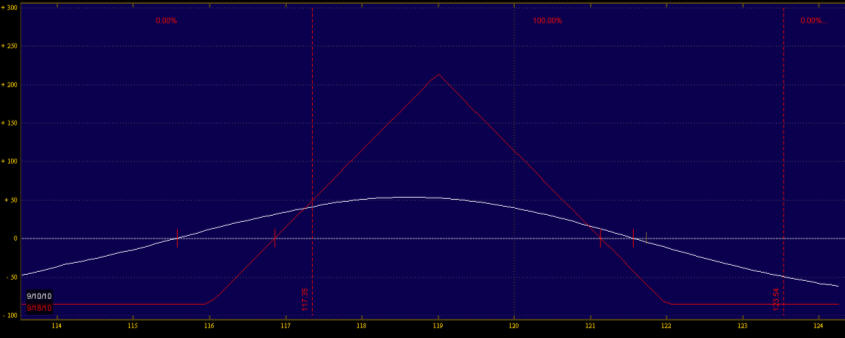
The red lines represent profit or loss at option expiration, the white line represents profit based on GLD’s price as of tomorrow based on the closing option prices and implied volatility. Clearly these numbers will change tomorrow when the market opens and throughout the trading day.
It is critical to keep in mind that the trade could be exited for gains before option expiration. Contingent stop orders could be placed to prevent maximum losses from occurring, and the initial range where profitability resides will be wider than $116.90 - $121.10, however every day that passes the gap will close until option expiration. There is an additional risk to this strategy besides just GLD’s price action and that is implied volatility. If GLD’s implied volatility increased dramatically causing the underlying option premiums to extend higher in price, this has the potential to dampen returns. However, as long as price cooperates and stays within the profitability bands, at option expiration the trade will be profitable since volatility impacts only the time value portion of the premium and we know that goes to 0 at expiration.
Butterflies are scary for beginners, but once a trader understands how they work and additional ways to manipulate them to enhance or protect profits, they become an absolute favorite trading strategy for many. Also notice that by using the butterfly strategy a trader can reduce his/her risk and achieve similar returns to the call/put credit spread illustrated above.
If I were going to use options to capture potential profit in the price action of gold, it is without question I would utilize a butterfly at this point in the option expiration cycle. The best part about using a butterfly is that its primary profit engine (Theta Decay) is inevitable. However, option traders that utilize this strategy must monitor implied volatility closely and as always, price action certainly matters regardless of which direction GLD decides to go. In addition, as butterflies approach their inevitable denouement at expiration, they become increasingly sensitive to price as the theta decay finishes its work. For this reason, price must be monitored carefully and dramatic price movements at expiration must be dealt with decisively.
In closing, I will leave you with the insightful muse of Rabindranath Tagore, “The butterfly counts not months but moments, and has time enough.”
If you would like to continue learning about the hidden potential options trading can provide please join my FREE Newsletter: www.OptionsTradingSignals.com
J.W. Jones is an independent options trader using multiple forms of analysis to guide his option trading strategies. Jones has an extensive background in portfolio analysis and analytics as well as risk analysis. J.W. strives to reach traders that are missing opportunities trading options and commits to writing content which is not only educational, but entertaining as well. Regular readers will develop the knowledge and skills to trade options competently over time. Jones focuses on writing spreads in situations where risk is clearly defined and high potential returns can be realized.
This article is intended solely for information purposes. The opinions are those of the author only. Please conduct further research and consult your financial advisor before making any investment/trading decision. No responsibility can be accepted for losses that may result as a consequence of trading on the basis of this analysis.
© 2005-2022 http://www.MarketOracle.co.uk - The Market Oracle is a FREE Daily Financial Markets Analysis & Forecasting online publication.