Four Financial Stock Charts to Watch
Stock-Markets / Company Chart Analysis Nov 03, 2010 - 01:35 PM GMTBy: Mike_Paulenoff
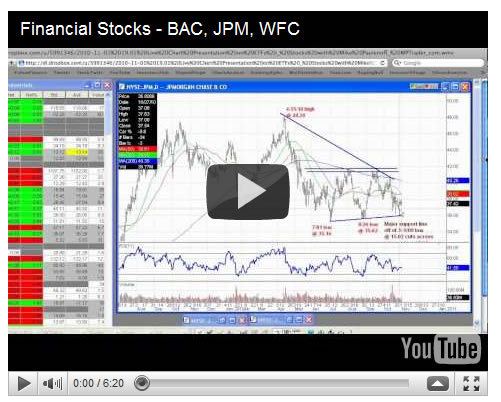
In our Webinar Monday evening, we reviewed the financial sector, a video clip of which is available in this Mid-Day Minute, and whose chart analysis is still very applicable today, ahead of the Fed announcement.
Starting with Bank of America (BAC), which has had a major correction already, my sense is that before it makes another downleg a rally is coming first. So if you think you want to be short BAC or long some inverted ETF, my sense is there'll be a higher price to do that. I think a rally can go close to 12.00. The larger picture is still in a massive downtrend, although if it's somehow able to chew through 13.00 and 14.00, then it will have broken out of that downtrend.
JP Morgan (JPM)'s chart doesn't do it for me on the long side. I understand that as long as it holds around 36, it's in okay condition, but the fact that it had a chance to break out and chew into resistance around 41-42 and failed suggests to me that this consolidation is going to fail. Maybe if BAC rallies to 12, JPM can attack the trendline again from the April high at around 39.30. But if it gets there, then I think it'll come back down and struggle to maintain support at around 35.62 to 35.16. If it breaks there it'll really have a problem.
Wells Fargo (WFC) looks a lot better than BAC and JPM, and has what can be considered a double low in the 23 1/4 to 22.90 area. But to get any traction it needs to take out resistance. If it closes above or accelerates through 26.50, then I think something positive is going on.
Citigroup (C) was my favorite and still has a pattern that looks good to me. From a weekly perspective, it has a series of lower highs and higher lows. If it can hurdle the 4.30-.32 area where it peaked last time, the next level would be the trendline at around 4.70. If it can somehow take out the trendline it would be very positive, with a target of close to 6.
Sign up for a free 15-day trial to Mike's ETF & Stock Trading Diary today.
By Mike Paulenoff
Mike Paulenoff is author of MPTrader.com (www.mptrader.com), a real-time diary of his technical analysis and trading alerts on ETFs covering metals, energy, equity indices, currencies, Treasuries, and specific industries and international regions.
© 2002-2010 MPTrader.com, an AdviceTrade publication. All rights reserved. Any publication, distribution, retransmission or reproduction of information or data contained on this Web site without written consent from MPTrader is prohibited. See our disclaimer.
Mike Paulenoff Archive |
© 2005-2022 http://www.MarketOracle.co.uk - The Market Oracle is a FREE Daily Financial Markets Analysis & Forecasting online publication.


