


Stock Markets Expected to Retreat from Fibonacci Retracement Level
Stock-Markets / US Stock Markets Oct 17, 2007 - 11:13 AM GMTBy: Marty_Chenard

 Fibonacci numbers are ignored by many investors and not understood. However, the Fibonacci retracement values of 38.2% and 61.8% are often very useful as we will see today.
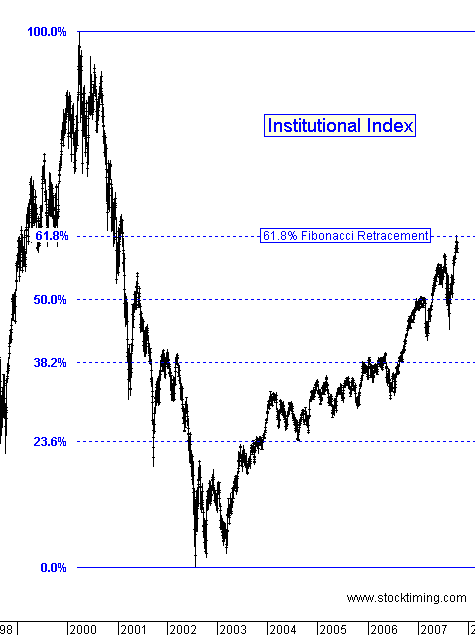
Below is a chart, of how the "Core Holdings" held by Institutions have performed since 1998. In early 2000, the index peaked and started a huge, bear market retreat. The absolute low was reached in 2002.
From this high to low data, we can construct a Fibonacci retracement chart such as the one seen below. Last week was the important week for Fibonacci followers, because the Institutional Index went up to an exact 61.8% Fibonacci retracement and then pulled back the next day. See chart 2 ...
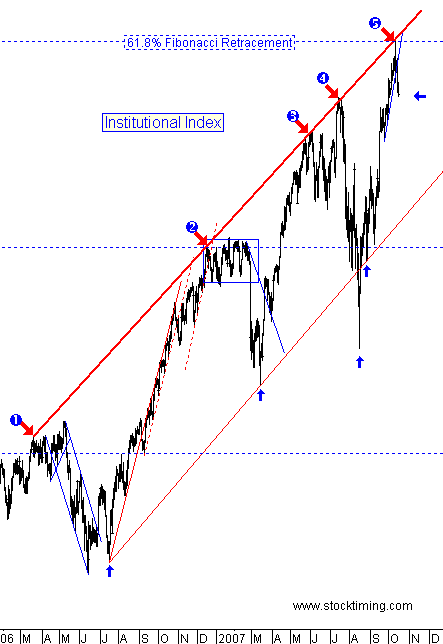
This is a close up chart from 2006 to yesterday. Note that the Institutional Index has been moving in an Up Channel since 2006 .
There have been 5 occasions where the index's price touched the upper channel's resistance and then retreated. Last week was such an occurrence as seen at label #5.
What is particularly noteworthy about last week, is that two critical resistance events occurred simultaneously.
A Fibonacci 61.8% retracement was reached, AND ... the index's Upper Channel resistance was reached at the same time, ON THE SAME DAY . This was then followed by a pull back on the price values of the core holdings held by Institutions. Since, Institution's account for over 50% of the market's volume, this event has obviously had an impact on the market.
___________________________________________________
We have had many requests for a regular update on what is happening relative to China's Shanghai Composite Index. So for the next few weeks, we will post the index here everyday ... below our normal free member, daily update.
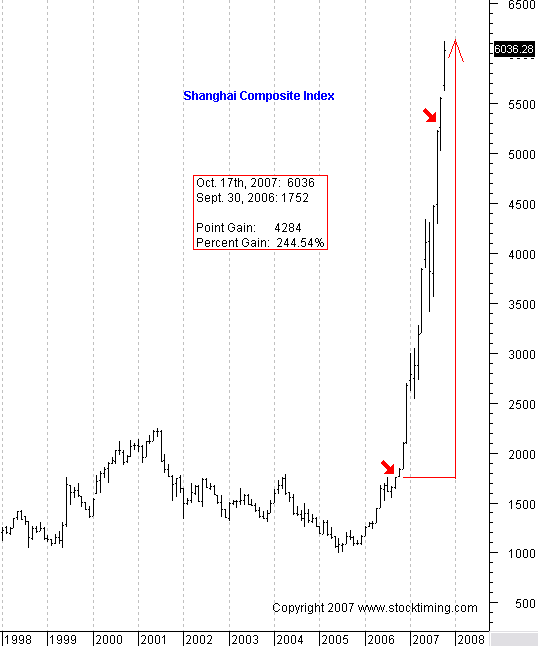
The Weekly Shanghai Index chart is below. This has clearly been an outstanding bubble for China's stock market. While it is in "out of control" territory, China still expects its citizens to invest around 42 billion dollars in the coming months.
As of this morning, the Shanghai Composite has gone up 244.54% since September 30th. of last year. Compare that to our stock market and you start to get the sense of how big of a bubble this is.
Straight up trajectories never last forever, and when they stop, they come down just as fast. There will be a real danger to worldwide indexes when this implodes, and will likely set off panic selling. Many analyst are now debating whether the index will continue up until the Olympics next August, or have a steep correction before then.
For now, Chinese investors are operating without fear, and nobody is taking profits because they feel it will move up for a very long time.
On the plus side, there is a lot more money that can move into the Shanghai ... and there are a lot of Chinese that haven't even started investing in the Shanghai yet.
However, there is a mathematical phenomenon associated with such expansions that shows how an implosion eventually occurs. I wrote about this last April, and it can be found at this link: Imploding-Investors
By Marty Chenard
http://www.stocktiming.com/
Please Note: We do not issue Buy or Sell timing recommendations on these Free daily update pages . I hope you understand, that in fairness, our Buy/Sell recommendations and advanced market Models are only available to our paid subscribers on a password required basis. Membership information
Marty Chenard is the Author and Teacher of two Seminar Courses on "Advanced Technical Analysis Investing", Mr. Chenard has been investing for over 30 years. In 2001 when the NASDAQ dropped 24.5%, his personal investment performance for the year was a gain of 57.428%. He is an Advanced Stock Market Technical Analyst that has developed his own proprietary analytical tools. As a result, he was out of the market two weeks before the 1987 Crash in the most recent Bear Market he faxed his Members in March 2000 telling them all to SELL. He is an advanced technical analyst and not an investment advisor, nor a securities broker.
Marty Chenard Archive |
© 2005-2022 http://www.MarketOracle.co.uk - The Market Oracle is a FREE Daily Financial Markets Analysis & Forecasting online publication.