


U.S. February Employment Situation, Consistent Message of Improvement But Inadequate to Terminate QE2
Economics / Employment Mar 05, 2011 - 10:31 AM GMTBy: Asha_Bangalore

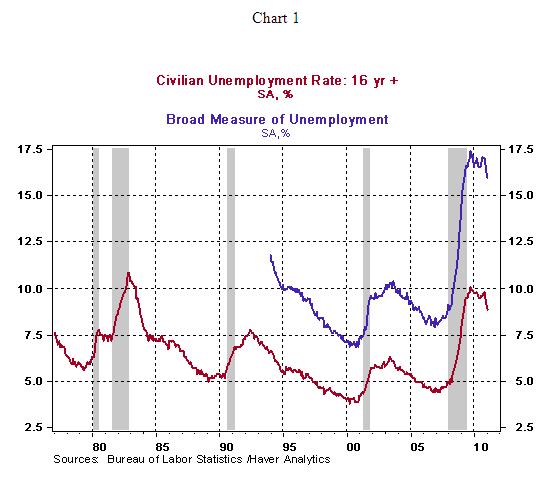
 Civilian Unemployment Rate: 8.9% in February vs. 9.0% in January. The unemployment rate was 5.0% in December 2007 when the recession commenced. Cycle high for recession is 10.1% in October 2009 and the cycle low (for the expansion that ended in December 2007) is 4.4% in March 2007.
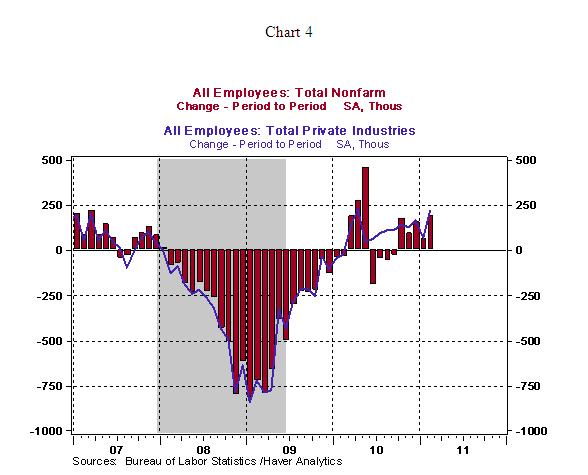
Payroll Employment: 192,000 in February vs. +63,000 in January. Private sector jobs increased 222,000 after a gain of 68,000 in January. Revisions for October and November resulted in a net gain of 58,000 jobs in the economy.
Private Sector Hourly Earnings: $22.87 in February vs. $22.86 in January; 1.7% yoy increase in February vs. 1.9% yoy gain in January.
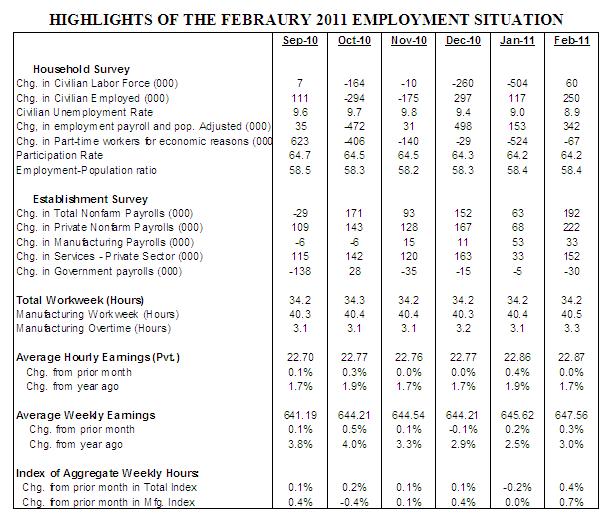
Household Survey - The civilian unemployment rate fell to 8.9% in February from 9.8%, 9.4%, and 9.0% in November, December, and January, respectively. The broad measure of unemployment declined to 15.9% from 16.1 in January. The participation rate was unchanged in February at 64.2%.
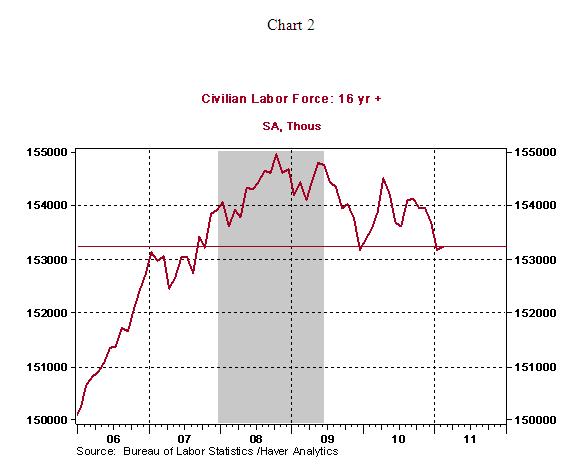
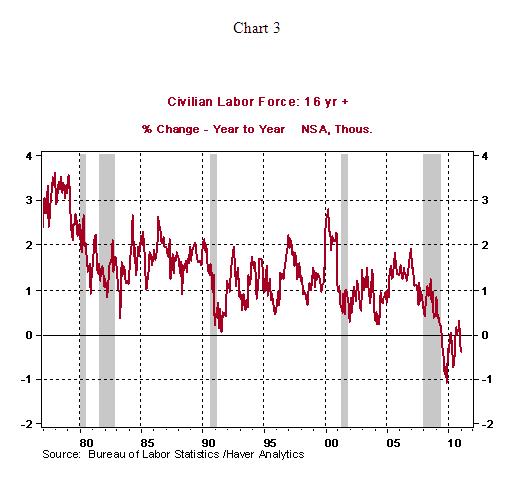
The labor force grew only 60,000 in February to 153.246 million, a level last seen in October 2007, excluding the December 2009 reading (see Chart 2). From a historical standpoint, the consistent reduction of the labor force is a new phenomenon that is not completely understood, as yet (see Chart 3).
Establishment Survey - Nonfarm payrolls increased 192,000 in February, after a revised gain of 63,000 in January. Revisions to December and January data resulted in a net addition of 58,000 more jobs. Hiring was widespread in the private sector during February 2011, with factory, construction, and service sectors posting gains, while government employment fell 30,000.
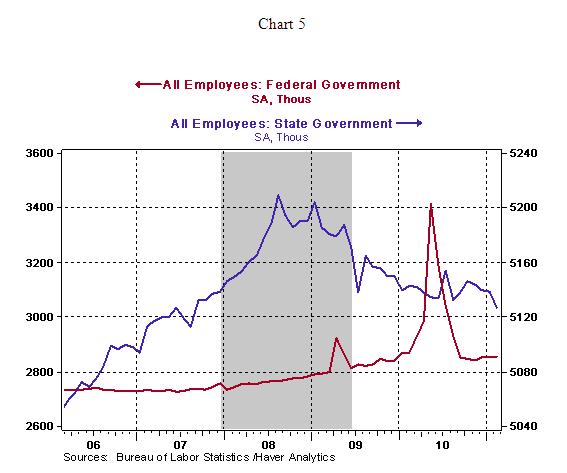
Factory employment has risen 195,000 from the trough in December 2009. Health care hiring is strong, with 260,000 jobs created in the last twelve months. Total government employment continues to decline, with the loss of local government jobs dominating the downward trend. Federal government hiring was temporarily lifted by Census 2010 last year. State government employment has dropped from the peak in August 2008 (see Chart 5).
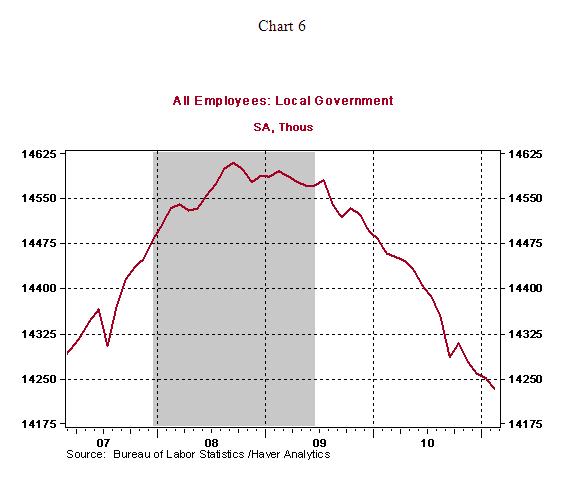
Local government payrolls have plunged 377,000 since the peak in September 2008 reflecting budgetary challenges (see Chart 6). These job losses are an additional source of pressure in the already soft private sector labor market.
Highlights of changes in payrolls during February 2011:
Construction: +33,000 vs. -22,000 in January
Manufacturing: +33,000 vs. +53,000 in January
Private sector service employment: +152,000 vs. +33,000 in January
Retail employment: -8,000 vs. +31,000 in January
Professional and business services: +47,000 vs. +35,000 in January
Temporary help: +15,500 vs. -4,900 in January
Financial activities: +3,000 vs. -12,000 in January
Health care employment: +34,300 vs. +8,700 in January
The manufacturing man-hours index advanced 0.7% in February which supports expectations of strong growth in industrial production for the month. Hourly earnings held nearly steady at $22.87, putting the year-to-year gain at 1.7%. The benign movement of wages is a plus for the Fed that is focused on promoting growth and price stability. The 0.3% increase in weekly earnings and the sharp increase in payrolls points to a more-than-moderate increase in the wage and salary component of personal income during February.
Conclusion - Both surveys in the employment report send a consistent message of strength in February after a mixed message in January that was partly related to bad weather. The recent unexpected jump in oil prices due to geopolitical reasons has complicated the FOMC's monetary policy balancing act. The significant shortfall in real GDP compared with potential, low readings of inflation, and sluggish hiring conditions, for the most part, leave the Fed on hold for several months and justify the completion of QE2.
There is dissent within the FOMC as seen in the minutes of the January FOMC meeting, although the voting pattern of this meeting does not reflect this. Against this backdrop and the bullish employment numbers published today, a relevant question to ask is: What are the necessary conditions under which the Fed will consider tightening of monetary policy? Monetary policy actions after the 1990-91 recovery offer clues.
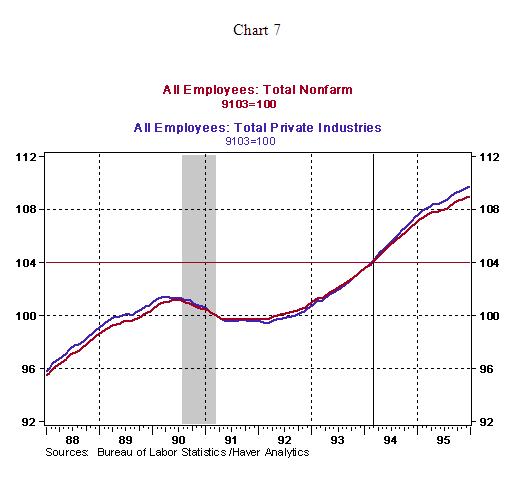
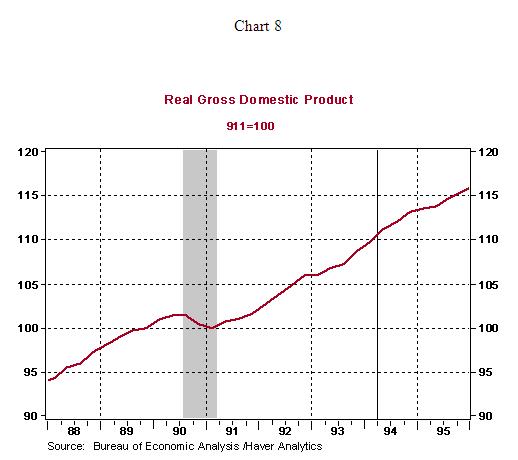
The economic predicament after 1990-91 recession is a comparable to the situation today because the economy was recovering from a banking crisis, the first Iraq war, and rising oil prices but, of course, the magnitude of the crisis was significantly smaller compared with current experience. During this period, the Fed held the federal funds rate at 3.00% from September 1992-February 1994. The high for the federal funds rate was 9.81% in May 1989, with the FOMC lowering the federal funds consistently through September 1992. Although the economic recovery commenced in March 1991, employment conditions were soft and economic growth was tepid to justify a tightening of monetary policy soon after the economy turned around by technical measures. The Fed resumed tightening monetary policy only in February 1994 when payroll employment had risen 4.0% from the trough in March 1991 (see Chart 7). Chart 7 is an index chart in which the payroll employment in March 1991 is set to 100. Chart 8 is an index chart for real GDP indicating that real GDP had advanced almost 10% from the trough before the Fed considered raising the federal funds rate.
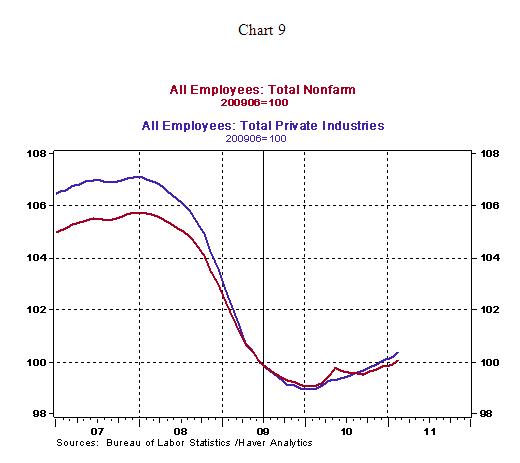
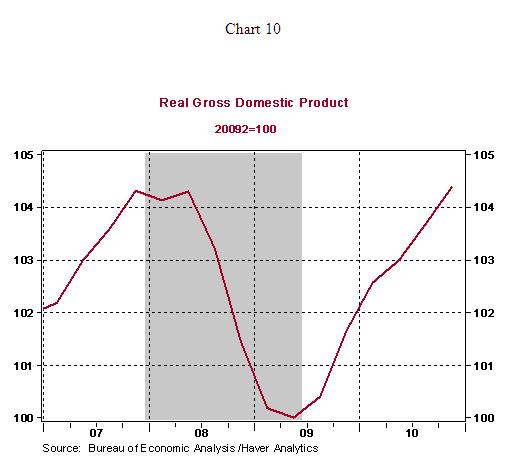
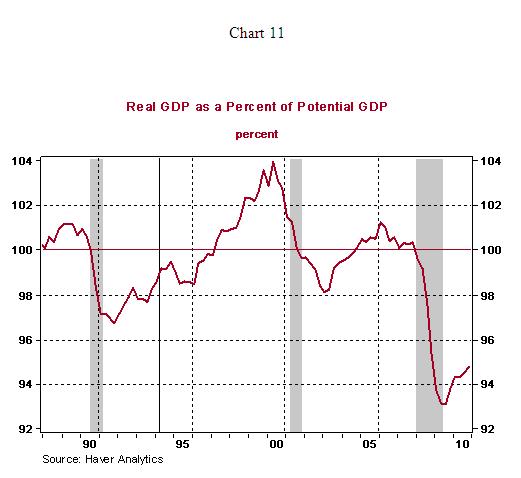
Repeating this exercise for the current period, shows that payroll employment is now matching the level of employment registered in June 2009, the trough of the current recovery (see Chart 9) and real GDP is about 4.4% higher than the level seen in the second quarter of 2009 (see Chart 10). These comparisons put into perspective about when the Fed may consider tightening monetary policy. Also, the Fed was pre-emptive when it applied monetary policy brakes in 1994 as real GDP was 1.5% short of potential GDP after the 1990-91 recession (see Chart 11). Currently, real GDP is roughly 5.0% points below potential GDP of the economy. In sum, this analysis, presents a compelling case for the Fed to stand pat in 2011.
Asha Bangalore — Senior Vice President and Economist
http://www.northerntrust.com
Asha Bangalore is Vice President and Economist at The Northern Trust Company, Chicago. Prior to joining the bank in 1994, she was Consultant to savings and loan institutions and commercial banks at Financial & Economic Strategies Corporation, Chicago.
Copyright © 2011 Asha Bangalore
The opinions expressed herein are those of the author and do not necessarily represent the views of The Northern Trust Company. The Northern Trust Company does not warrant the accuracy or completeness of information contained herein, such information is subject to change and is not intended to influence your investment decisions.
© 2005-2022 http://www.MarketOracle.co.uk - The Market Oracle is a FREE Daily Financial Markets Analysis & Forecasting online publication.