


Stock Markets Review, Asia Weak But Western Markets Strong
Stock-Markets / Stock Markets 2011 May 01, 2011 - 02:54 PM GMTBy: Tony_Caldaro

 The US market started the week making new uptrend highs and this progressed into new bull markets highs into week’s end. Positive economic reports outpaced negative reports about two to one. On the positive side: New/Pending home sales, Consumer confidence, Public sentiment and Durable goods orders rose; Personal income/spending and PCE prices remained positive, and the Monetary base hit a new record high.
On the negative side: Q1 GDP, the Case-Shiller index, the Chicago PMI, the M1-multiplier and the WLEI were all lower; plus weekly Jobless claims rose. For the week the SPX/DOW were +2.2%, and the NDX/NAZ were +1.5%. Asian markets declined 1.5%, European market rose 2.1%, the Commodity equity group was -0.8%, and the DJ World index was +1.8%. US Bonds gained 0.8%, Crude was +1.5%, Gold rose +3.8%, and the USD was -1.3%. Next week will be highlighted by ISM, Auto sales and the Payrolls report.
LONG TERM: bull market
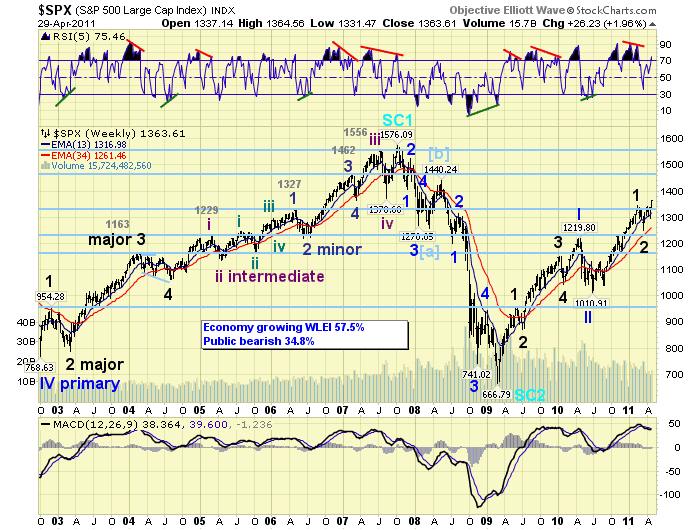
The worldwide bull market continues to unfold as anticipated. A Cycle wave [1] bull market off the March 2009 Supercycle wave 2 low is underway. The Cycle wave is unfolding in five Primary waves, and these waves are dividing into Major waves as the bull market unfolds. From the Mar09 low at SPX 667 Primary wave I completed in Apr10 at SPX 1220. Its five Major waves unfolded as follows: Major 1 SPX 956 Jun09, Major 2 SPX 869 Jly09, Major 3 SPX 1150 Jan10, Major 4 SPX 1045 Feb10, and Major 5 SPX 1220 Apr10. Primary wave II then took three months and bottomed in Jly10 at SPX 1011. Since then Primary wave III has been underway. Thus far, Primary wave III has completed two of its Major waves: Major 1 SPX 1344 Feb11 and Major 2 SPX 1249 Mar11. Major wave 3 has been underway since that low and is already making new bull market highs. We continue to anticipate a bull market high in early 2012 after Primary waves III, IV and V complete.
MEDIUM TERM: uptrend high SPX 1365
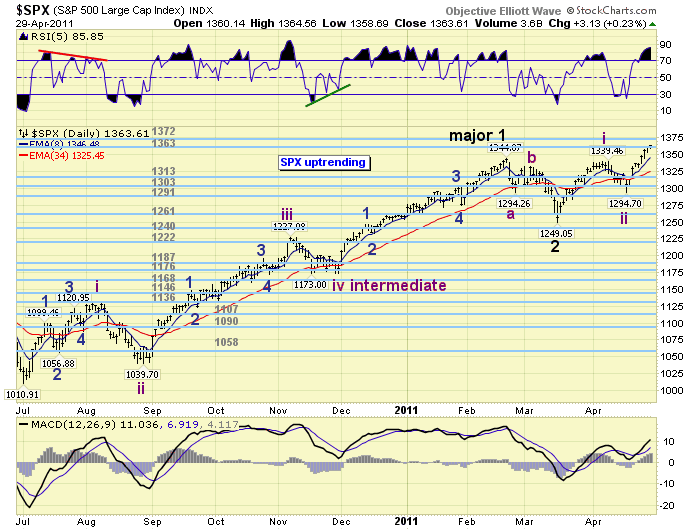
The Major wave 3 uptrend that started on March 16th at SPX 1249 has been underway for about a month and a half. This week it hit SPX 1365 a new bull market high. Since it is a Major wave it will divide into five Intermediate waves. The first two of these Intermediate waves have already concluded: Int. 1 SPX 1339 April 8th, and Int. wave 2 SPX 1295 April 18th. Intermediate wave three has been underway since that low. If we apply Fibonacci relationships to target a potential high for Intermediate wave three we arrive at two levels: SPX 1385 and 1441. At SPX 1385 Int. 3 = Int. 1, and at SPX 1441 Int. 3 = 1.618 Int. 1. It just so happens the next two OEW pivots, right after the current 1363/1372 resistance pivots, are 1386 and 1440. Near perfection! Our target for Major wave 3 remains between SPX 1440 and 1462 by June 2011.
SHORT TERM
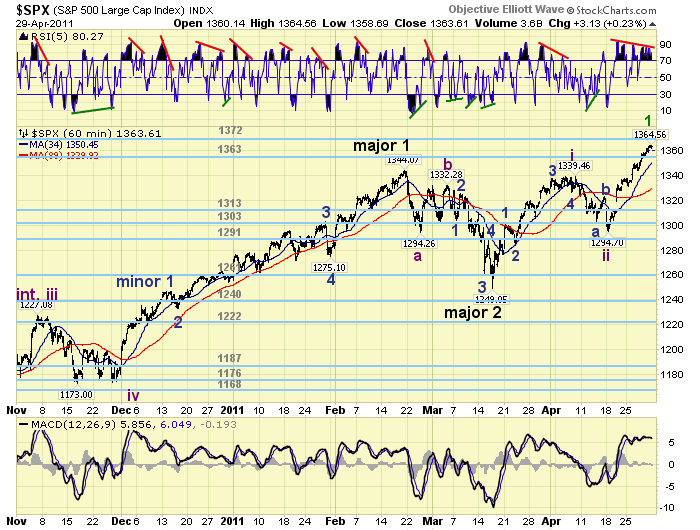
Support for the SPX is at 1363 and then 1313, with resistance at 1372 and then 1386. Short term momentum continues to display a double negative divergence. Thus far Intermediate wave three has been fairly relentless. Since it began on April 18th at SPX 1295 the largest pullback, it was only seven points, occurred on April 25th. This market has rallied 70 points in 8 trading days with only a 7 point pullback along the way. Quite strong indeed and typical of a third, (Intermediate three), of a third, (Major wave 3), of a third, (Primary wave III). With short term momentum continuing to display a double negative divergence we would expect a pullback of at least 10 to maybe 20 points in the near future. The OEW 1363 pivot range has been our target for Minor wave 1 and the market is right there. After a Minor wave 2 pullback Minor waves 3, 4 and 5 would still be needed to complete Intermediate wave three. Best to your trading!
FOREIGN MARKETS
Asian markets lost 1.5% on the week. Japan and China have switched roles recently. Japan’s NIKK is in a confirmed uptrend, and now China’s SSEC is in a confirmed downtrend.
European markets gained 2.1% on the week. Finally all five indices are in confirmed uptrends.
The Commodity equity group lost 0.8% on the week. All three indices remain in uptrends.
DJ World index continues to uptrend and gained 1.8% on the week.
COMMODITIES
Bonds gained 0.8% on the week. The long term trading range remains in place.
Crude continues to uptrend and gained 1.5% on the week to new uptrend highs.
Gold remains in its uptrend to new all time highs and gained 3.2% on the week. We are going to release a Silver report shortly.
The USD continues to downtrend losing 1.3% on the week.
NEXT WEEK
Quite a number of economic reports this week. On monday, Construction spending and ISM manufacturing at 10:00. Then monthly Auto sales in the afternoon. Tuesday we have Factory orders, then on wednesday we have ADP and ISM services. Thursday, weekly Jobless claims and Productivity. Then on friday the monthly Payrolls report, Unemployment rate and Consumer credit. The FED has two speeches on the agenda. FED chairman Bernanke in Chicago on thursday, and FED vice chair Yellen in Finland on friday. Best to your week!
CHARTS: http://stockcharts.com/...
http://caldaroew.spaces.live.com
After about 40 years of investing in the markets one learns that the markets are constantly changing, not only in price, but in what drives the markets. In the 1960s, the Nifty Fifty were the leaders of the stock market. In the 1970s, stock selection using Technical Analysis was important, as the market stayed with a trading range for the entire decade. In the 1980s, the market finally broke out of it doldrums, as the DOW broke through 1100 in 1982, and launched the greatest bull market on record.
Sharing is an important aspect of a life. Over 100 people have joined our group, from all walks of life, covering twenty three countries across the globe. It's been the most fun I have ever had in the market. Sharing uncommon knowledge, with investors. In hope of aiding them in finding their financial independence.
Copyright © 2011 Tony Caldaro - All Rights Reserved Disclaimer: The above is a matter of opinion provided for general information purposes only and is not intended as investment advice. Information and analysis above are derived from sources and utilising methods believed to be reliable, but we cannot accept responsibility for any losses you may incur as a result of this analysis. Individuals should consult with their personal financial advisors.
© 2005-2022 http://www.MarketOracle.co.uk - The Market Oracle is a FREE Daily Financial Markets Analysis & Forecasting online publication.