


UK Property Sellers Inflated Asking Prices Risks Chasing After House Prices Downward Spiral
Housing-Market / UK Housing Jun 10, 2011 - 01:02 AM GMTBy: Nadeem_Walayat

 The UK housing market depression continues as Labours election bounce has long since evaporated, many home owners relieved that the house price crash had stopped during early 2009 had put their plans to sell on the back burner as they envisaged a return to the 'norm' of rising house prices, this expectation continued even after the coalition government took office and announced unprecedented spending cuts and tax rises during mid 2010, and scheduled to start from April 2011.
Potential sellers who held off from selling during the election bounce of 2010, will have increasingly been alarmed by the return of falling house prices during late 2010 and into 2011, which especially has had wide regional variations in trend which is in line with local economies that are reliant on the public sector which encompasses most of the UK outside of the South East and especially cities in the North of England, Wales and Northern Ireland.
UK Home Sellers Inflated Asking Prices - Sheffield Example
However as the following analysis illustrates, most sellers are making the same mistake today that was made during the housing market crash of 2007-2009 in that asking prices for houses for sale are far above the market valuations for their properties, the result of this is for home owners to effectively chase house prices lower as they are forced to cut prices in response to falling house prices and thus in the end delaying sales as well as receiving far less than they would have originally sold their properties for if they had attached more realistic values in the first place.
This analysis is for the North England city of Sheffield where the asking prices of 300 properties out of approx 2,500 properties for sale during the month of May 2011 were analysed against valuations obtained from a number of free property valuation sites.
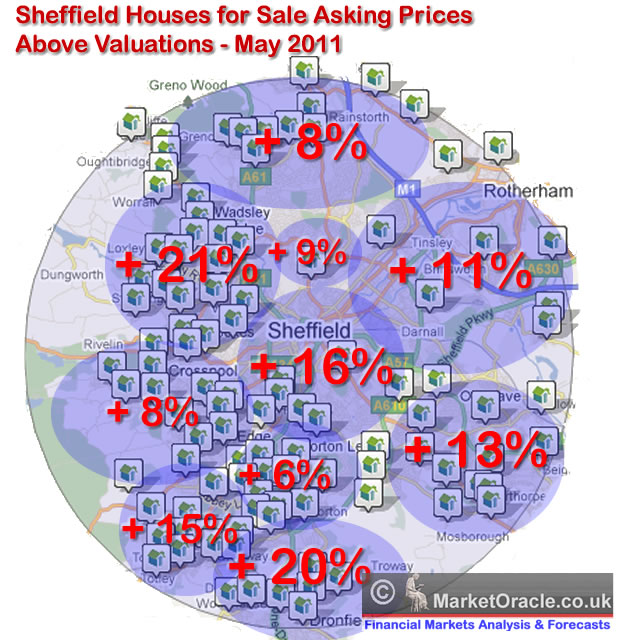
The analysis concludes in an overall overvaluation of asking prices of approx 13%, which is inline with what was typical during the boom years. However the average masks wide variations between areas of the city that range between properties being typically 6% over valued against 21% over valued. The over valuations where not related to either wealthier or poorer areas but rather a mix of both.
Conclusions
1. One possible reason why over valuations and realistic valuations tend to cluster by area's is because home sellers tend to look at what price others in an area are also selling for.
2. There may be greater competition in overvalued areas between estate agents for business therefore a tendency to give properties higher valuations so as to secure business and shut out other agents, then a few months down the road when properties have failed to sell ask clients to cut asking prices.
Sellers
The net result is that grossly over valued properties will fail to sell, and thus sellers risk chasing the market ever lower remaining just out of reach of buyers interest. Therefore sellers need to get multiple valuations to get a more realistic price and if their property fails to attract any interest to not delay in cutting their price by as much as 10% or more so as to attract buyer interest. Else you risk wishing you had cut earlier and thus obtained a higher final sale price.
Buyers
If buying do your research, look at what similar previous properties actually sold for in the area you are targeting. If a house looks fairly priced compared against others in the area then ensure that there is not a reason why it differs in price, which may be due to issues such as the property is leasehold instead of freehold, or that there is an issue for instance with flooding.
Expand your analysis of house prices city wide so that you can appreciate if areas are over or fairly valued as there is a tendency for over valuations to cluster in areas as sellers tend to price according to what other sellers in an area are expecting to achieve.
This analysis shows that properties tend to be over valued by an average of 13%, therefore you should aim for initial offers to be at least 10% below the asking price in most cases for cities such as Sheffield.
Implications for House Prices
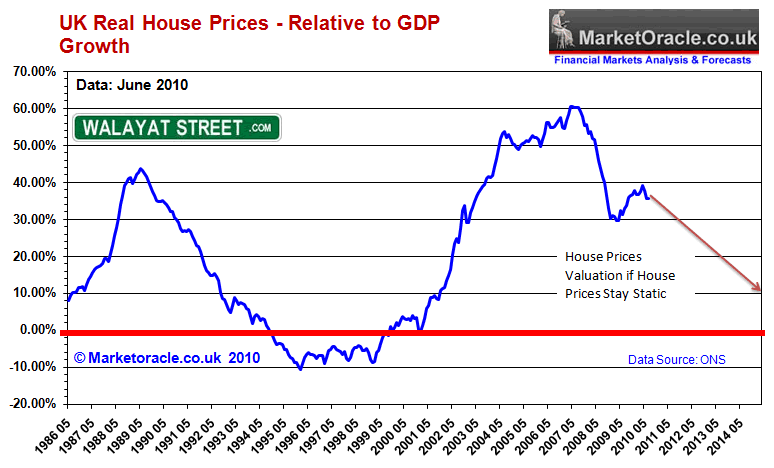
Confirms existing conclusion for a continuing depression with prices drifting lower towards new bear market lows due to over hang of supply as many sellers repeat the mistake of not valuing their property inline with what the market will bear.
UK House Prices Trend Forecast
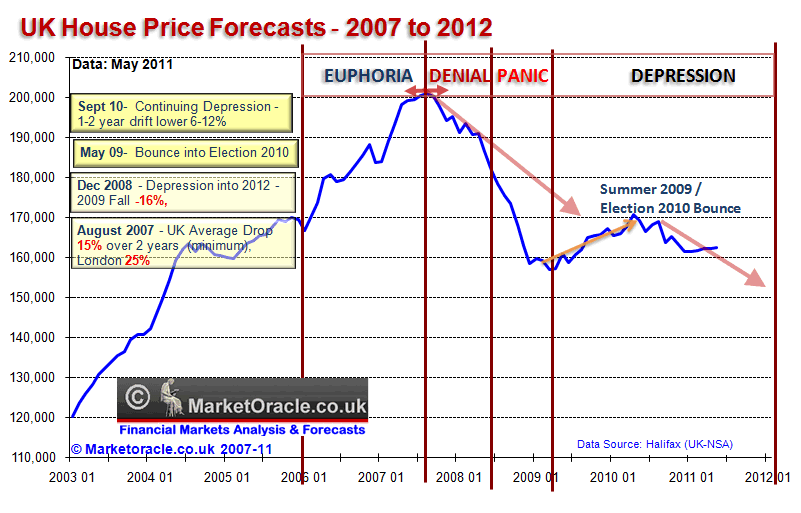
This analysis forms part of series that aims to conclude towards a multi-year trend forecast for UK house prices that aims to replicate the accuracy of past analysis (more than 150 housing market analysis articles) and concluding trend forecasts as illustrated by the first graph, including the original forecast made right at the very peak of the UK housing market in August 2007:
22 Aug 2007 - UK Housing Market Crash of 2007 - 2008 and Steps to Protect Your Wealth
The UK Housing market is expected to decline by at least 15% during the next 2 years. Despite the 2012 Olympics, London is expected to fall as much as 25%. UK Interest rates are either at or very near a peak, as there is an increasingly diminishing chance of a further rise in October 2007. After which UK interest rates should be cut as the UK housing market declines targeting a rate of 5% during the second half of 2008. The implications for this are that the UK economy is heading for sharply lower growth for 2008.
Last In-depth Analysis / Forecast -03 Sep 2010 - UK House Prices and GDP Growth Trends Analysis
 '
'
Conclusion - GDP Growth trend analysis points to a continuing depression in the UK housing market for the next 3-4 years, with the most probable outcome being for a gradual shallow drift lower in prices over the next 1-2 years (6-12%), followed by a further 1-2 years of base building.
Ensure you are subscribed to my always free Newsletter to receive in depth analysis and forecasts in your email in box (only requirement is a valid email address).
Source and Comments: http://www.marketoracle.co.uk/Article28594.html
By Nadeem Walayat
Copyright © 2005-2011 Marketoracle.co.uk (Market Oracle Ltd). All rights reserved.
Nadeem Walayat has over 25 years experience of trading derivatives, portfolio management and analysing the financial markets, including one of few who both anticipated and Beat the 1987 Crash. Nadeem's forward looking analysis focuses on UK inflation, economy, interest rates and housing market. He is the author of three ebook's - The Inflation Mega-Trend; The Interest Rate Mega-Trend and The Stocks Stealth Bull Market Update 2011 that can be downloaded for Free.

Nadeem is the Editor of The Market Oracle, a FREE Daily Financial Markets Analysis & Forecasting online publication that presents in-depth analysis from over 600 experienced analysts on a range of views of the probable direction of the financial markets, thus enabling our readers to arrive at an informed opinion on future market direction. http://www.marketoracle.co.uk
Disclaimer: The above is a matter of opinion provided for general information purposes only and is not intended as investment advice. Information and analysis above are derived from sources and utilising methods believed to be reliable, but we cannot accept responsibility for any trading losses you may incur as a result of this analysis. Individuals should consult with their personal financial advisors before engaging in any trading activities.
Nadeem Walayat Archive |
© 2005-2022 http://www.MarketOracle.co.uk - The Market Oracle is a FREE Daily Financial Markets Analysis & Forecasting online publication.