


Are We Really In A Stocks Bear Market Yet?
Stock-Markets / Stock Markets 2011 Aug 29, 2011 - 05:50 AM GMTBy: Andre_Gratian

 SPX: Very Long-term trend - The very-long-term cycles are down and, if they make their lows when expected, there will be another steep and prolonged decline into 2014-16.
SPX: Intermediate trend - The 1101 low of 8/22 appears to be holding and may mark the bottom of the intermediate downtrend which started at 1370 on 5/02.
Analysis of the short-term trend is done on a daily basis with the help of hourly charts. It is an important adjunct to the analysis of daily and weekly charts which discusses the course of longer market trends.
Market Overview
A decline started slowly from 1370 in the SPX, and accelerated sharply after a bearish Head & Shoulders pattern had been formed. Its downward target has already been fulfilled. The intensity of the decline and, especially, the amount of distribution which took place between 5/02 and 7/22, have all the markings of a beginning bear market, but this will remain unconfirmed until we break below 1011.
The best way to support a point of view is to see if you can find arguments against it. If you can't, it is confirmed. If, however, you can, you have to re-examine your premise. I have already alluded to the fact that there are some technical and sentiment conditions which are not characteristic of a bear market. Now, something else is taking place that could eventually add to the ambiguity. Since the 1101 low, the SPX has created a sizeable Point & Figure formation which is fast approaching the dimension of the one created at the top. Should it be resolved on the upside (pure speculation at this time), it could, at a minimum, create a double-top before the bear market resumes.
The above comments concern the SPX. Now, I want to show you the Weekly Chart of an another equity index which goes back beyond the 2007 top, and I want you to tell me - objectively - if it looks long-term bearish or bullish! I have purposely left out all the markings which could serve to identify this index in order to make the analysis even more impartial. No pre-conceived bias! Start with your very first impression, and try to disprove it. Only scroll to the bottom of the chart, and take your time analyzing it.
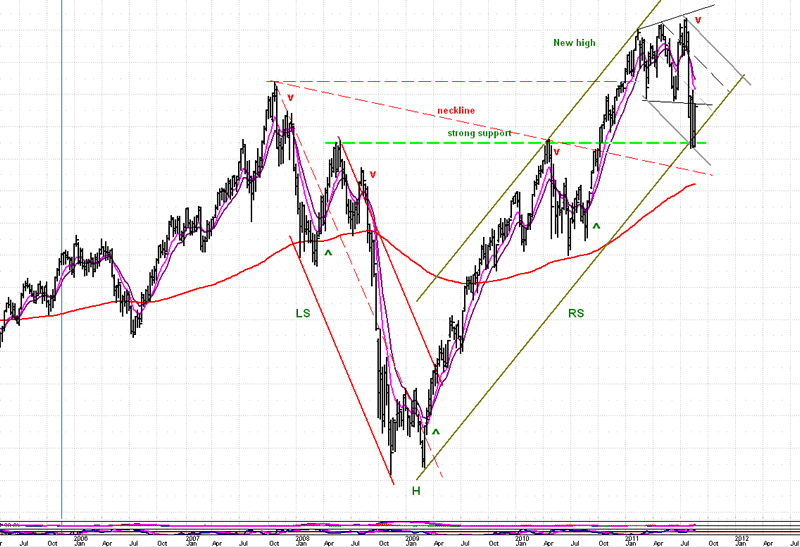
Ihope you have formed an opinion. Let's see if it matches what I think: I see a massive reverse Head & Shoulders pattern which broke out above the neckline, went substantially beyond its 2007 high (thereby establishing a very long-term uptrend pattern), made an expanding triangle top which was followed by a correction that satisfied the Fibonacci target for that pattern. At the same time, it retraced about 50% of its former intermediate uptrend, while finding support at the very top of a strong support level which also coincides with the lower trend line of its long-term up-channel and, in the process, pulled back to the H&S neckline. All this is technical perfection! Now, the index has every right to resume its uptrend and make a new high which could be quite a bit higher if it fulfills the promise of the reverse H&S formation. It would be technically illogical, at this time, to say that this equity index has started a bear market trend. Of course, if it broke below its recent low by a substantial margin, we would be forced to consider that possibility.
This is the best example I could find to contradict the notion that we have started a bear market. If this index proves, by its subsequent behavior, that it is on its way to making a new high, it is logical to assume that other equity indices will follow, and this is why the title of my last newsletter was:
"THE LONG TERM LOOKS BLEAK - NOT THE SHORT TERM"
Now, let's see what the SPX is doing which might support this view.
Chart analysis
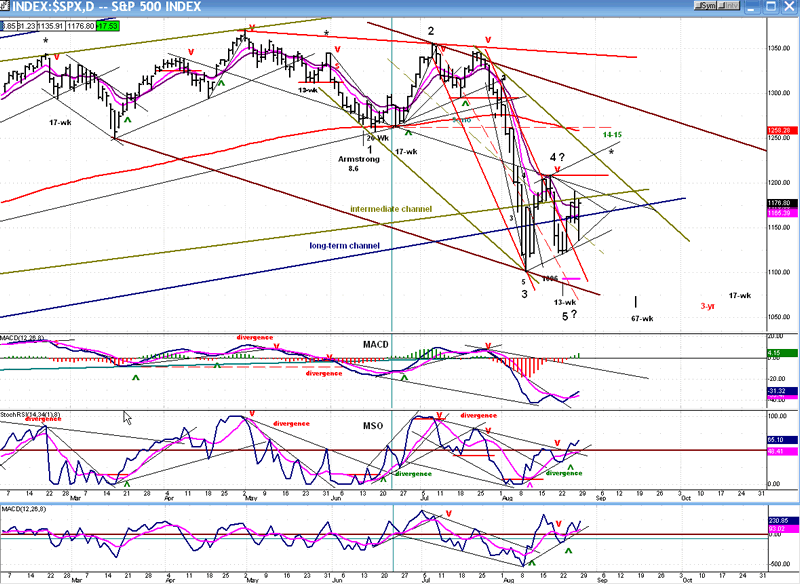
We'll start with the Daily Chart. It has been steadily improving and may even have given a short-term buy signal on Friday. The price has moved out of the two steepest channels, and is about to challenge the intermediate mid-channel line. If it can do that successfully, it will next have to overcome the green channel. Finally, it will need to come out of the brown intermediate channel.
Since all the indicators are now in an uptrend with the MACD and MSO making new highs while the price has not yet done so - a sign of positive divergence - The SPX has an opportunity to continue its upward progress; it would be best if the A/D joined in with a new high also. But we should not kid ourselves! There is a lot of work to be done before the index can confirm that it has resumed its uptrend. Besides all the trend and channel lines that it has to break, it will need to make a new near-term high by overcoming the top of the initial rally (red horizontal line). Next, it will have to get above its 200-DMA which, by the time it gets there, will probably coincide with the brown downtrend line and the formidable resistance at the 1248-1258 levels.
Near-term, it should get some assistance from the 14-15-wk high-to-high cycle scheduled to top in the second week of September, but after that, it will have to resist successfully the downward pull of other cycles into early to mid-October. That will be the real test! Should it fail to make a new low into that time period, or if it simply double-bottoms, the potential bullish scenario will not be endangered.
Structurally, the bottom pattern could evolve in a number of ways. The index could be making a wave "4" in the form of a triangle, before making a new low with wave "5". If the index goes past 1191 next week, that possibility will be eliminated and change to a simple A-B-C pattern (or some other count), which would prevail even if it went past 1208. A more bullish assumption would be that wave "5" has already made its low in a truncated form (failed), but it is likely that we won't resolve the structural ambiguity until after the 3-yr cycle has made its low.
Next, let's turn to the Hourly Chart to get a sense of what might happen next week.
When it came down in the form of what probably resulted in a truncated "5" (which would be bullish because the full potential P&F projection of 996 was not reached), the SPX formed a base which I have marked in light green. On the P&F chart, that base yields a potential count of 1238 if the lower phase is considered, and 1284 if the entire pattern is counted. Both projections would take the index past the former high which would eliminate the triangle "4" possibility.
The chart is currently bullish and so are the indicators. Friday, the index had a chance to make a new low. Instead, after being down 24 points in early trading, it turned around and closed up 17.53 for the day. That is not bearish action! Some of the indicators are overbought, but as long as they do not show negative divergence and are still above their support lines, the trend is up.
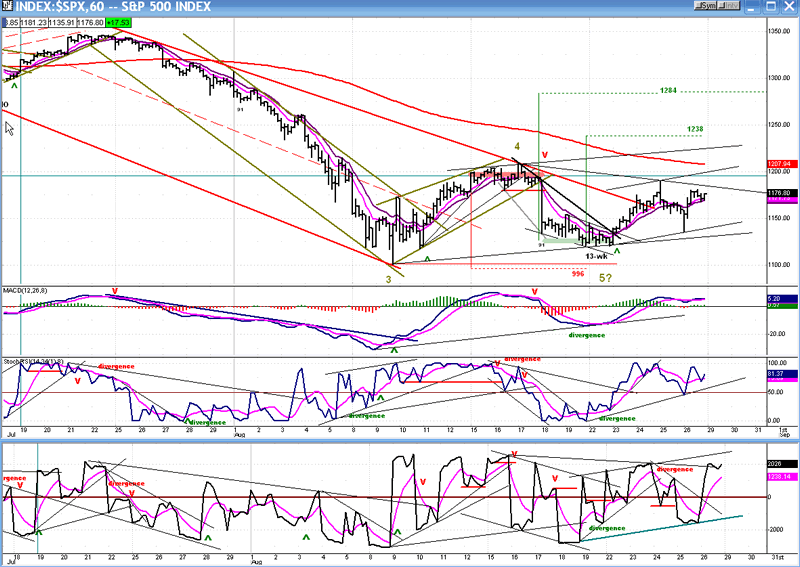
After reaching 1181, it looked as if the index could retrace to 1165 before continuing its rally, but the closing action was strong and makes me wonder it has not already had its correction and is ready to move higher!
Cycles
The cycles potentially affecting the stock market over the next 2-3 months are marked on the daily chart, above. The most important (the 3-yr cycle) is scheduled to bottom in October. If the SPX does not make a new low by then, the case for doubting the bear market scenario will have been strengthened.
Breadth
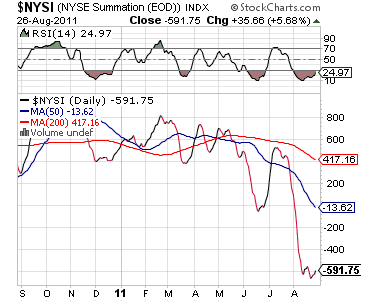
The NYSE Summation Index (courtesy of StockCharts.com) remains very oversold and, if it follows its typical pattern, should start moving up until its RSI is again overbought.
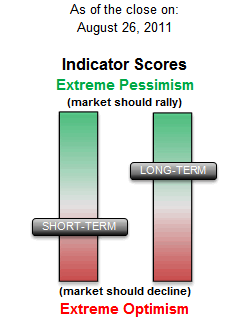
Sentiment
The long-term index of the SentimenTrader (courtesy of same) remains bullish, but it has become mildly bearish for the short-term.
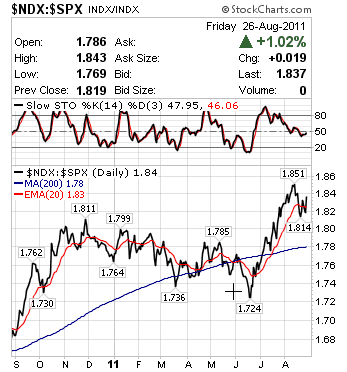
The relative strength of the NDX to the SPX is something that has caused me to have second thoughts about being in a bear market. Although the chart shows a little deterioration, it is not enough to turn it bearish. You may already have guessed that the "mystery chart", at the beginning, was that of the NDX.
GOLD
Gold appears to be at an important juncture, and this calls for a detailed commentary. GLD just had a climactic move to the projections which I had given it. In a climactic thrust, instead of pausing at 180-82, it moved straight up toward its ultimate (for now) projection of 187-189. Although it stopped short by a couple of points and has already had a quick three-day pull-back of 19 points (which typifies reaching an important P&F target) followed by a strong bounce, it is likely that this is only the beginning of a correction that will take some time to complete.
Stocks and indexes which are primarily traded by traders and speculators have some price moves that are pure technical beauty, and this is one of them. Until it got into high gear, gold was traded in a well-defined (green) channel that went back to its 11/08 low. In a climactic frenzy which most likely marks the completion of this phase, the index went to a point which was exactly twice the width of the original channel. At the same time, it reached a resistance line caused by the extension of a former trend line (red dashes). A parallel to this extension drawn from the next low on the chart, is precisely where the 3-day correction found support and had a sharp bounce which could prove to be the right shoulder of a H&S pattern. If (when) the decline resumes, GLD could find (temporary) support at the next lower dashed parallel.
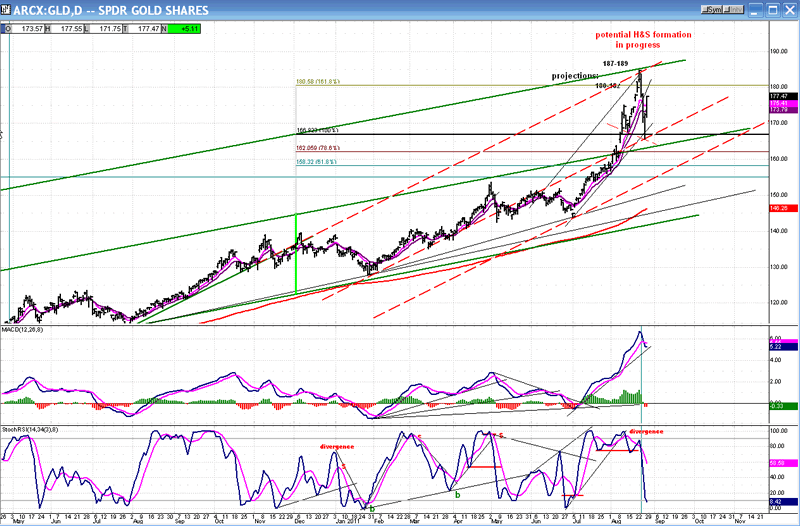
How much of a correction would be fitting for this 3+ years uptrend? The last comparable phase ended at 119, after which the index retraced a little better than 50% of its previous move. A similar retracement, this time, would take it a little below 125. A .382 pull-back would stop at about 140. And if the top pattern does becomes a valid H&S, its projection would be roughly 145 which, by the way, currently happens to be the level of the 200-DMA. Even if the top does not evolve into a H&S pattern, it is likely that GLD has made an important intermediate top and is ready for a significant correction.
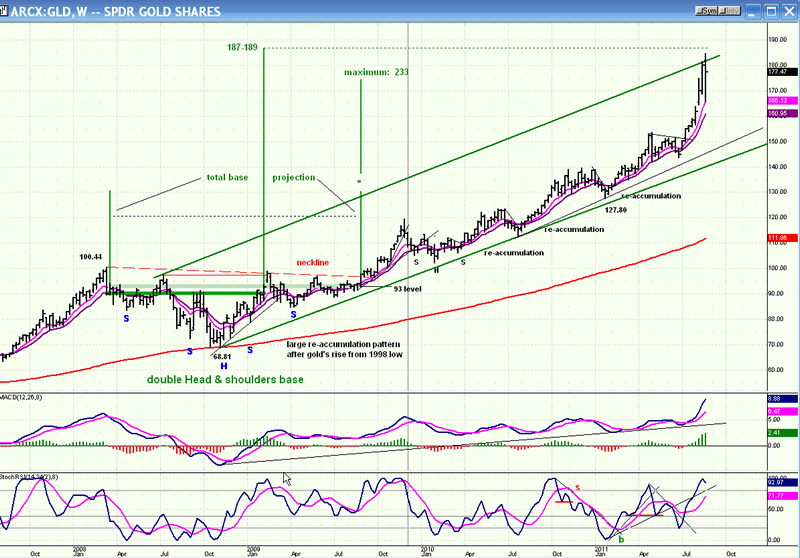
This probability is better illustrated on the Weekly Bar Chart and P&F Chart of GLD. An uptrend in Gold started in 1998 and culminated in early 2008, after which it made an 18 months re-accumulation pattern which took the form of a double reverse Head & shoulders formation. On the P&F chart, the smallest H&S formation of that pattern gave a projection to about 155. While one might have expected GLD to have an important correction after reaching this target, it only paused for 10 weeks and, as investor anxiety was increased by intensifying domestic and world turmoil, it pushed ahead toward its next higher projection of 187-189 (entire dark green bar).
Because this is the maximum count which can be derived from the 89 accumulation level, and this also marks the completion of an important phase in its uptrend, it is likely that GLD is about to experience its deepest and most lengthy correction since the 2008 low. But this will probably only result in a pause in GLD's long-term ascent. After sufficient time has passed to re-establish a balance in the price of gold, the very long-term cycles bottoming in 2014 -- and the world events normally associated with this phenomenon -- will probably dictate that the next higher GLD count across the 93 level (light green bar) be considered. This could lead to a minimum price of 203, and perhaps to a maximum of 233, which would roughly correspond to a high of 2350 for gold.
I have done this extensive analysis of gold, because it dovetails with the analysis of equity markets and supports the view that higher prices are in store for them, including the possibility that QQQ will eventually reach about 67. While, for a long time, gold was moving along with the equity markets, since the SPX top of May 2 it has moved countertrend to them in a more normal relationship. In fact, gold started its blow-off phase early in the month of July at about the time that the SPX prepared to crash.
If QQQ reaches 67(a well-founded P&F projection), that would put the NDX roughly at 2725 according to today's ratio between the two. And the SPX? I know that this will sound crazy but, if the current NDX to SPX persists, it could see 1490!!!. With this in mind, let's see if this scenario holds up, or if it is quickly dashed by more severe selling taking place.
Summary
My objective analysis of the market's technical condition is telling me to be cautious about establishing a mind-set that a bear market has started. This may very well be so, but it will require more confirmation than we have experienced so far.
According to prevailing cycles, the time between the second week in September to early October, may be when a budding uptrend in the market will be tested. If the SPX and other equity markets can remain above their lows of early August (the higher, the better), the opportunity for a resumption of the bull market will be enhanced.
FREE TRIAL SUBSCRIPTON
If precision in market timing for all time frames is something which is important to you, you should consider a trial subscription to my service. It is free, and you will have four weeks to evaluate its worth.
For a FREE 4-week trial. Send an email to: ajg@cybertrails.com
For further subscription options, payment plans, and for important general information, I encourage you to visit my website at www.marketurningpoints.com. It contains summaries of my background, my investment and trading strategies and my unique method of intra-day communication with Market Turning Points subscribers.
By Andre Gratian
MarketTurningPoints.com
A market advisory service should be evaluated on the basis of its forecasting accuracy and cost. At $25.00 per month, this service is probably the best all-around value. Two areas of analysis that are unmatched anywhere else -- cycles (from 2.5-wk to 18-years and longer) and accurate, coordinated Point & Figure and Fibonacci projections -- are combined with other methodologies to bring you weekly reports and frequent daily updates.
“By the Law of Periodical Repetition, everything which has happened once must happen again, and again, and again -- and not capriciously, but at regular periods, and each thing in its own period, not another’s, and each obeying its own law … The same Nature which delights in periodical repetition in the sky is the Nature which orders the affairs of the earth. Let us not underrate the value of that hint.” -- Mark Twain
You may also want to visit the Market Turning Points website to familiarize yourself with my philosophy and strategy.www.marketurningpoints.com
Disclaimer - The above comments about the financial markets are based purely on what I consider to be sound technical analysis principles uncompromised by fundamental considerations. They represent my own opinion and are not meant to be construed as trading or investment advice, but are offered as an analytical point of view which might be of interest to those who follow stock market cycles and technical analysis.
Andre Gratian Archive |
© 2005-2022 http://www.MarketOracle.co.uk - The Market Oracle is a FREE Daily Financial Markets Analysis & Forecasting online publication.