


What's Next for the Stock Market S&P500 and Gold?
Stock-Markets / Stock Markets 2011 Aug 29, 2011 - 06:13 AM GMTBy: Chris_Vermeulen

 Now that Mr. Bernanke’s speech is old news, what was the financial media thinking exactly? A significant number of financial writers have been anticipating discussion of QE III or QE III Lite which clearly were never even on the Fed Chief’s radar this week. The focus of the Jackson Hole Summit was how to achieve long-run growth, not conduct discussion of monetary policy.
QE III will not be discussed openly until the next FOMC meeting in September, which noticeably was extended to two days. Besides the extension and the Fed Chairman’s prediction of growth in the back half of the year, the remainder of Mr. Bernanke’s speech was nothing more than a brief synopsis of what he has already said in the recent past.
While Chairman Bernanke focuses on the U.S. economy, I have been more inclined to monitor the action across the pond. Price action in Europe is having a major impact on financial markets here in the United States. Traders are monitoring credit default swap (CDS) spreads on European sovereign debt as well as on domestic and European banks.
Recently U.S. banks have seen the CDS swaps on their debt rising indicating that the marketplace believes their debt is a greater risk to investors. While the price action is nowhere near the 2008 & 2009 levels, current prices are relatively consistent with what was seen during the correction in the late spring of 2010. While there is no reason to panic at this point, this is a trend that I will be monitoring closely going forward.
For now, I continue to believe that equity markets will rally in coming weeks as conditions are extremely oversold. The price action so far today makes sense as the wild price swings helped flush out weak hands that were long. Consequently, the snap back rally pushed shorts into stop levels as well.
A significant move lower does not seem likely at this point, but a retest of the recent lows is possible, if not probable. I would remind readers that stock market crashes generally happen within the context of an oversold market. While the likelihood of a crash is remote, it is still possible and tight risk definition in this environment is warranted regardless of which side of the tape a trader is playing.
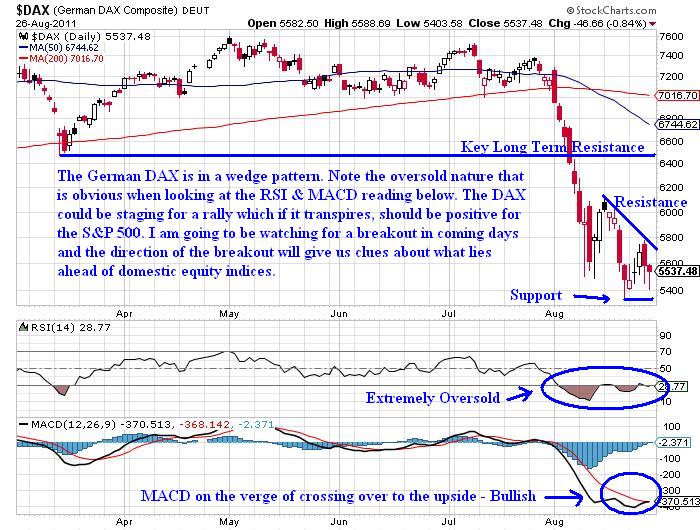
One price chart that I have been watching closely is the German DAX. The German DAX is presently a thermometer for traders to monitor the situation in Europe. The reason the German stock market index is so important is due to the financial strength of Germany within the Eurozone. Without Germany, the Eurozone would crumble in on itself and the Euro currency would be in trouble. Recently Germany’s equity markets have been crushed and the daily chart below illustrates the recent carnage:
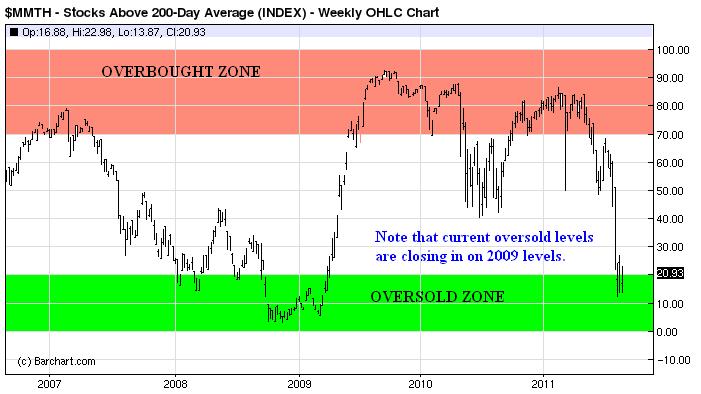
Another metric I monitor regularly is market momentum. The chart below illustrates the number of domestic stocks trading above their 200 period moving averages. As can be seen below, the U.S. equity market has not been this “oversold” since back in 2009. Chart courtesy of Barchart.com.
In my previous article posted back on August 18th, I discussed the likelihood for stocks to pullback and put in some form of a basing pattern. I wrote the following statement in that article:
“It is entirely plausible that Mr. Market thrusts lower from here to shake out longs. If that scenario plays out it could potentially carve out a double bottom or another basing pattern which would give active traders another entry point to get long.”
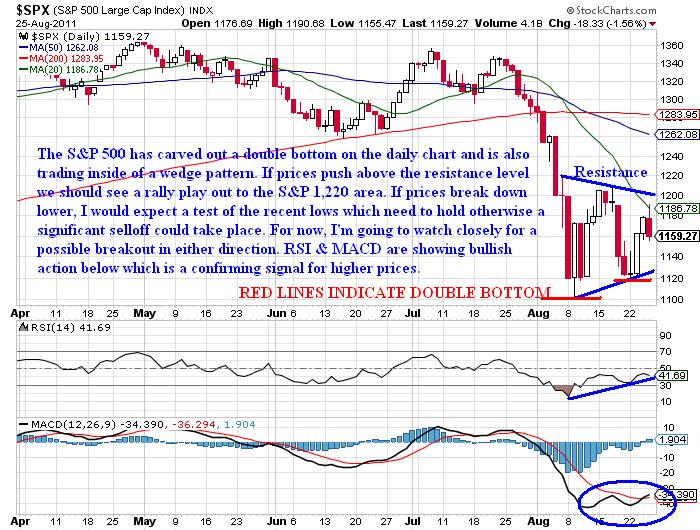
Since August 18th, we have seen the S&P 500 push lower and there is a double bottom on the daily chart which is capturing quite a bit of attention in the trading community. I would also draw your attention to the wedge pattern that is also present. A breakout higher or lower out of this wedge pattern will be the clue that will indicate Mr. Market’s short term price direction. I continue to believe we will see a breakout higher, but a retest of the lows is always a possibility. The daily chart of the S&P 500 Index is shown below:
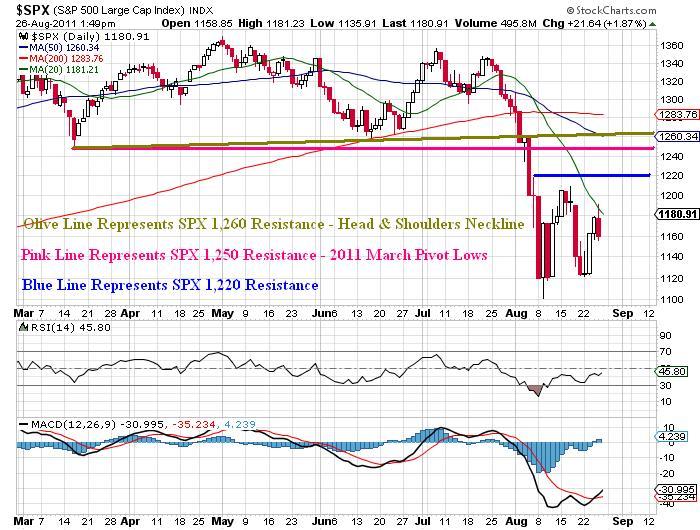
In the short to intermediate term, I believe we will see higher prices and a test of the key S&P 1,220 area or possibly a re-test of the key S&P 1,250 price level which corresponds with the March 2011 pivot lows. Additional resistance would come in around the 1,260 – 1.270 area which marks the neckline of the recent head and shoulders pattern which triggered the selloff in the S&P 500. The daily chart of the SPX below illustrates the key resistance areas:
Gold Analysis
My most recent article argued that gold prices were going parabolic and that a pullback was likely. We have seen a major pullback in gold prices. Admittedly, I was about $200 an ounce early on my call, but members of my service were able to capitalize on an option trade that captured 32% based on maximum risk through the use of a double calendar spread. While my timing was not precise, the juiced volatility in the GLD options allowed me to roll contracts forward and make additional adjustments to produce a strong gain for the service.
Some traders argue that gold prices are going to rally back sharply in short order, which I find hard to believe. Instead, I am of the opinion that we could see additional downside in the weeks/months ahead in gold prices. There is an ominous pattern starting to form on the gold daily chart which if it is carved out and triggered, it could produce the next leg of this selloff. The daily chart of gold is shown below:
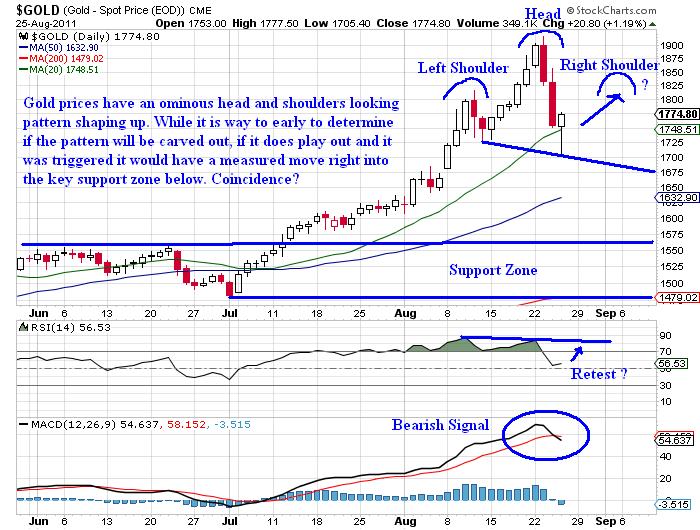
While it is far too early to determine if a head and shoulders pattern will be carved out or if lower prices take place, I am of the opinion that this selloff will offer an attractive entry point for longer term investors. At this point it is a bit too early to get involved, but if my analysis is accurate the next leg of the gold bull market will be potentially extreme.
While I believe stocks will rally in the short to intermediate term, I am of the opinion that we have officially entered the next phase of the bear market. The next wave lower in stocks is going to be just as severe as the likely rally in gold.
The reason I believe gold will rally is primarily due to future weakness in Europe. If European banks have a credit crisis, a sovereign nation unexpectedly defaults, Germany leaves the Eurozone, or a currency crisis transpires gold prices should soar while U.S. equity prices tank.
While it is far too early to make that determination, if the S&P 500 puts in a lower high on this next advance higher and consequently takes out the recent lows on a selloff, the bear will be in full swing and gold prices should take off. The chart below illustrates my expectations for the S&P 500 in the future:
The next few weeks are going to be very telling about the future in domestic markets. Is this just a correction that pushes stocks higher by the end of the year, or is this the beginning of something far worse?
For now I am going with the latter, but price action in coming weeks will offer clues about what lies ahead for U.S. equity markets. Right now this is nothing more than speculation, but the next few months should be very interesting. Risk remains exceedingly high.
Join Now at http://www.optionstradingsignals.com/specials/index.php for a 24 hour 66% off coupon.
JW Jones & Chris Vermeulen
By Chris Vermeulen
Chris@TheGoldAndOilGuy.com
Please visit my website for more information. http://www.TheGoldAndOilGuy.com
Chris Vermeulen is Founder of the popular trading site TheGoldAndOilGuy.com. There he shares his highly successful, low-risk trading method. For 6 years Chris has been a leader in teaching others to skillfully trade in gold, oil, and silver in both bull and bear markets. Subscribers to his service depend on Chris' uniquely consistent investment opportunities that carry exceptionally low risk and high return.
This article is intended solely for information purposes. The opinions are those of the author only. Please conduct further research and consult your financial advisor before making any investment/trading decision. No responsibility can be accepted for losses that may result as a consequence of trading on the basis of this analysis.
© 2005-2022 http://www.MarketOracle.co.uk - The Market Oracle is a FREE Daily Financial Markets Analysis & Forecasting online publication.