


U.S. Stock Market the New Safe Haven?
Stock-Markets / Stock Markets 2012 Jan 08, 2012 - 12:48 PM GMTBy: Tony_Caldaro

 2012 starts off with one interesting day, then returns to the inflection point. Overall, US indices did well for the week with the SPX/DOW +1.40%, and the NDX/NAZ +3.05%. Global equity markets were less robust as Asian markets gained 0.9%, European markets lost -0.4%, and the DJ World index gained 0.8%. US economic reports for the week were quite impressive: nine positive versus two negative. On the uptick: ISM, construction spending, factory orders, the ADP, the Payrolls report, the M1-multiplier, plus both weekly jobless claims and the unemployment rate declined. On the downtick: the monetary base and the WLEI declined. Next week we have the FED’s beige book, retail sales and consumer sentiment.
LONG TERM: inflection point
The stock market continues its battle between the deflationary forces of this Secular bear cycle, and the reflationary forces of the FED liquidity cycle. Currently it appears balanced, in the middle, awaiting the next tipping point. While the US economy has been gradually improving, the European economy has been sliding down the slope of hope. Will another European sovereign debt problem emerge, sending equity markets worldwide lower? Or, will the FED come to the rescue, yet again, with another Quantitative Easing program?
When the 2011 European debt crisis first hit, the US market was just concluding its first failed uptrend since Mar 2009. When the crisis hit full stride in July and August markets worldwide dropped around 20%. Then, after some volatile weeks in August and September the EU announced, in the beginning of October, they would recapitalize the banks and resolve the crisis. The markets soared. Four weeks later the SPX hit 1293, peaking on the day of the finalized EU announcement. After that, the markets corrected while none of the plans were enacted. In early December the ECB could wait no longer and initiated LTRO 2 to recapitalize the banks. Now, more than two months after the finalized EU announcement, the SPX has climbed back to just under that eurphoric 1293 high. Since we do not believe the LTRO 2 program is enough to re-establish the bull market. Some additional liquidity will be required soon, or the stock market will roll over and likely resume the bear market.
From an OEW perspective we see two potential counts. We can count five Major waves up from the Mar09 SPX 667 low to complete a Primary wave I at SPX 1371. After that, the market corrected in five waves down to SPX 1075 to complete either Primary wave II, (a 38.2% retracement with an extended flat), or Major wave A of Primary wave II. The three wave rally from that low can be counted as an ongoing ABC Major wave B, or a Major 1-2 and Intermediate wave i. The answer to this dilemna may not be resolved by the waves themselves. But by the actions, or inactions, of the EU and/or the FED and ECB. Keep in mind, if the FED had not acted when they did we may have entered, and still be in, a depression. Massive liquidity ended the Supercycle bear market in Mar09. Additional liquidity was required, since then, to keep the bull market going. Until the deflationary pressures of this Secular bear cycle ends, possibly around 2016, reflationary liquidity is the only offsetting factor.
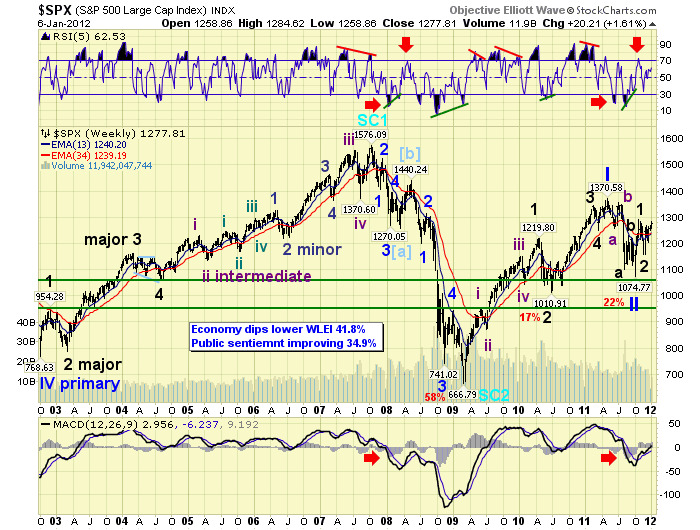
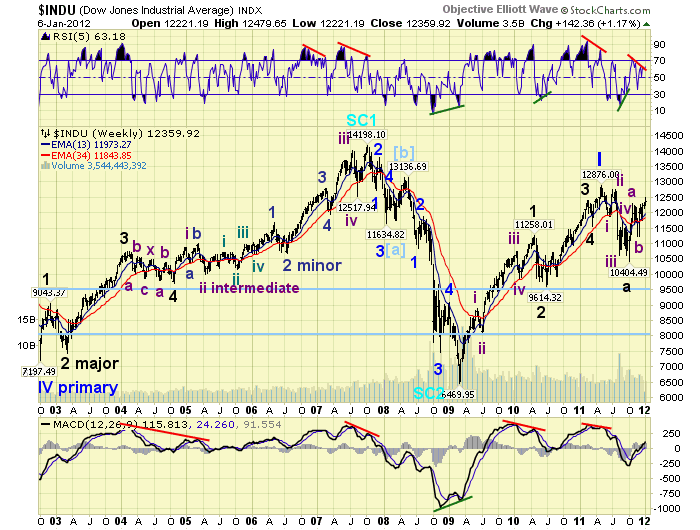
The SPX displays the count with the bullish outcome, and the DOW the bearish.
MEDIUM TERM: uptrend
Upon review of the technicals after the first week of 2012 we do see improvement. Our smart money indicators are turning positive again for the first time since August. This is important. Weekly and monthly RSI are rising. Eight of the nine SPX sectors are in uptrends. Market breadth has been improving. The NYSE percentage of stocks above their 200 DMA is hitting a higher high, and the VIX has been downtrending. Plus, 15 of the 20 worldwide markets we track are in uptrends, and the commodity market is uptrending. The SPX cleared the OEW 1261 pivot without an immediate reversal. Which is what occurred at the October high. Plus, the NDX/NAZ gapped above that potential contracting wedge formation, we noted last week, and made a new uptrend high on friday. Some of these are welcomed surprises! In response to these positive technical developments, we have removed the tentative bearish green overlay on the SPX daily chart. The inflection point is currently leaning towards a positive outcome. We would rate the probable outcome, at this time, as 55% – 45% bullish.
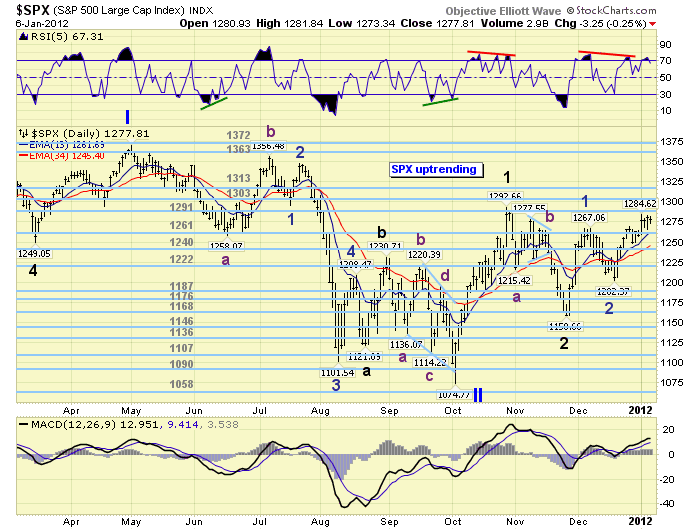
We have been counting the current uptrend, from the late-November SPX 1159 low, as an Intermediate wave one of Major wave 3 of Primary III on the SPX charts. Major wave 1 looked quite impulsive, uptrending from SPX 1075 to 1293 in less than four weeks. Major wave 2 downtrended, in a corrective pattern, to SPX 1159 by late November retracing, precisely, 61.8% of Major wave 1. The current uptrend, Intermediate wave one, entered its second month on tuesday with the new uptrend high. None of the previous uptrends, from the May SPX 1371 high, have lasted more than one month. This is a positive. Also, the entire decline from SPX 1371 to 1075 lasted five months, and the current rally is three months old. This is a clear deviation from the 2007-2009 bear market scenario: when the market declined for five months, rallied for two, then declined for another ten months.
Currently only the DOW has exceeded its October high. The SPX closed the week about 1% below its October high, and the NDX/NAZ are about 2%-3% below their October highs. Should these lagging indices exceed their October highs the general market will likely gather some upside momentum extending the uptrend.
One last note. When we reviewed our proprietary smart money indicator this weekend we observed something quite unusual. During 2011 every foreign market we track, nineteen, turned negative with long term sell signals. But the US stock market did not. Remember, OEW still has the US stock market in a long term uptrend since 2009. We had noticed the weakness in the foreign markets around mid-year and anticipated a selloff in the US would likely follow. The US market then declined more than 20% into the October low, but ended the entire year flat. The foreign markets were not that fortunate. For now, it appears, smart money has been exiting foreign markets and moving into the US market. One thought comes to mind. Since the FED was the first to act aggressively during the 2008/2009 crisis, the US will be the first market to recover economically.
SHORT TERM
Support for the SPX remains at the OEW 1261 and then 1240 pivots, with resistance at the 1291 and 1303 pivots. Short term momentum ended the week around neutral. The first rally to SPX 1267, after the November downtrend low at SPX 1159, was clearly impulsive and we labeled it Minor wave 1. The pullback that followed, to SPX 1202, retraced 61.8% of that rally, was clearly corrective, and we labeled it Minor wave 2. The current rally from that low also looks impulsive, and we have been labeling it with the subdivision Minute waves of Minor wave 3.
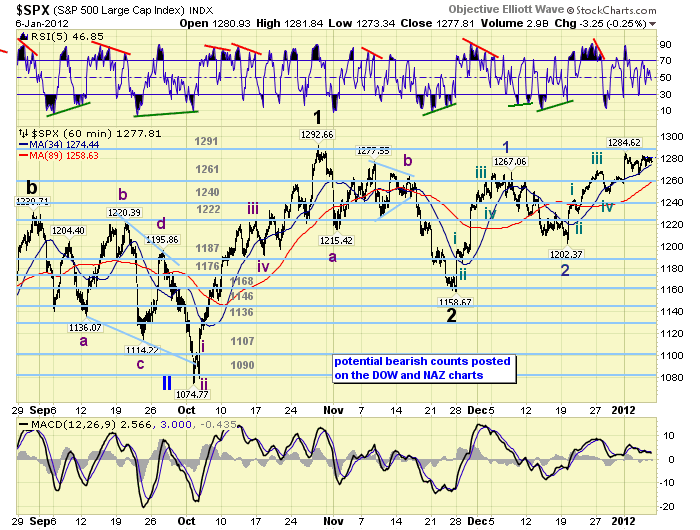
At tuesday’s SPX 1285 high we can count five waves up from the 1202 low. This suggests several potential short term counts should the uptrend continue. First, Minute wave five will subdivide and extend. Second, the five waves up was only Minute wave one, and the recent 20 point pullback, the largest of this rally, was Minute wave two. Third, Minor wave 3 has completed, and the market is currenctly in some sort of Minor wave 4 triangle. We’ll favor the first scenario for now. If the uptrend peaked at SPX 1285. Then it would appear the uptrend was an ABC rally off the November SPX 1159 low, and a five wave downtrend should follow to retest that low and form a larger ABC flat, ending Major wave 2.
Short term OEW charts have remained positive for almost three weeks now. Short term support is at the 1261 pivot, 1250, and then the 1240 pivot. Overhead resistance is again at SPX 1278, then the 1291 and 1303 pivots. With the narrow range of SPX 1265-1285 last week, the market should tip its hand quite early this week. Should the SPX clear 1285 early this week, the uptrend continues. Should the SPX break below 1265 early this week, a downtrend may be underway. Best to your trading!
FOREIGN MARKETS
The Asian markets were mostly higher on the week for a net gain of 0.9%. China, Hong Kong, India and Singapore remain in downtrends.
The European markets were mixed on the week for a net loss of 0.4%. All are in uptrends.
The Commodity equity group were all higher on the week for a net gain of 2.7%. Only Russia is still in a downtrend.
The DJ World index is uptrending and gained 0.8% on the week.
COMMODITIES
Bonds remain in a narrow range uptrend, but lost 0.3% on the week. The 10YR closed out the week under 2.0% again, while the 30YR ended just above 3.0%.
Crude remains quite volatile and is uptrending yet again. It gained 2.8% on the week.
Gold has been rallying off the $1524 low a week ago thursday. The rally looks impulsive, volume has been good, and it has already risen $108 from that low. It gained 3.4% on the week.
The USD continues its uptrend from the July low at 73.42 (DXY). It gained 1.3% on the week. We believe our long term scenario for the major currencies continues to unfold. The USD is now in a long term, seven year, ABC bull market. The EUR, GBP, CHF, CAD and JPY all appear, some confirmed and others not, in long term ABC bear markets versus the USD. Will update this report soon: http://caldaro.wordpress.com/2011/08/15/foreign-currency-and-usd-update-2/.
NEXT WEEK
Monday kicks off the economic calendar with Consumer credit at 3:00. On tuesday we’ll get Wholesale inventories, then on wednesday the FED’s beige book. Thursday provides weekly Jobless claims, Retail sales, Business inventories, and the Budget deficit. Then on friday, the Trade deficit, Export/Import prices, and Consumer sentiment. The FED has one speech scheduled: friday at 11 AM FED governor Duke speaks on regulations and credit availability. Best to your week, and have a healthy and prosperous New Year!
CHARTS: http://stockcharts.com/...
http://caldaroew.spaces.live.com
After about 40 years of investing in the markets one learns that the markets are constantly changing, not only in price, but in what drives the markets. In the 1960s, the Nifty Fifty were the leaders of the stock market. In the 1970s, stock selection using Technical Analysis was important, as the market stayed with a trading range for the entire decade. In the 1980s, the market finally broke out of it doldrums, as the DOW broke through 1100 in 1982, and launched the greatest bull market on record.
Sharing is an important aspect of a life. Over 100 people have joined our group, from all walks of life, covering twenty three countries across the globe. It's been the most fun I have ever had in the market. Sharing uncommon knowledge, with investors. In hope of aiding them in finding their financial independence.
Copyright © 2011 Tony Caldaro - All Rights Reserved Disclaimer: The above is a matter of opinion provided for general information purposes only and is not intended as investment advice. Information and analysis above are derived from sources and utilising methods believed to be reliable, but we cannot accept responsibility for any losses you may incur as a result of this analysis. Individuals should consult with their personal financial advisors.
© 2005-2022 http://www.MarketOracle.co.uk - The Market Oracle is a FREE Daily Financial Markets Analysis & Forecasting online publication.