


Gold Stocks To Rally Like During The Great Depression And Early 70s
Commodities / Gold & Silver Stocks Jan 30, 2012 - 07:15 AM GMTBy: Hubert_Moolman

 Below, is an extract of my Gold Mining Fractal Analysis Report.
"He answered and said unto them, When it is evening, ye say, It will be fair weather: for the sky is red. And in the morning, It will be foul weather to day: for the sky is red and lowering." ~ Jesus Christ
During the Great Depression, at a certain point, gold stocks started a massive rally. While most things were going down in price, gold stocks made significant gains, becoming one of the best performing sectors during that time.
It was no coincidence that gold stocks performed as well as they did. Like all goods, gold stocks will thrive under the ideal conditions. During the Great Depression, those ideal conditions were present.
The purpose of this editorial is to look at what those conditions were, and identify a pattern that was present before and during those rallies. If we are able to identify those circumstances and pattern, we could look to see if they are present today, or in the future, in order to know when to expect a massive gold stocks rally. - end of extract.
I then go on to identify those ideal circumstances and patterns that were present before and during the great gold stocks rally. The conditions today are very similar to then, and is an ideal set-up for a most spectacular gold stocks rally over the coming months. Here, I would like to illustrate, by way of a chart, how the conditions were similar.
The gold stock rally of the 1930s coincided with major economic decline, as well as a significant increase in the real price of gold. Below, is a chart (from planbeconomics.com) of the long-term Gold/Oil ratio:
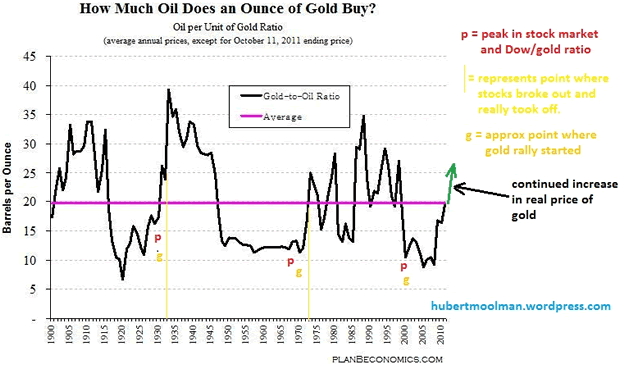
On the chart I have highlighted a peculiar pattern that exists just before the gold stocks rallies of the Great Depression and the early 70s. The pattern is basically:
- The peak in the stock market (DOW) and Dow/Gold ratio - point p
- Gold rallies significantly from about after 1 - point g
- After a significant bottom in the Gold/Oil ratio and after that ratio has been rising for quite some time.
Note that the yellow lines in the chart represent the point where the gold stocks really took off (broke out)
Currently, conditions are setting up in a similar manner to the Great Depression and the early 70s. We have a significant bottom in the long-term Gold/Oil ratio, we have had a peak of the Dow and the Dow/Gold ratio (in 1999) and we have had a gold rally that started after 1999, and is about to accelerate. We are also at a point where major economic decline can be expected (see my previous video), similar to the decline during the Great Depression.
So, it appears that we have conditions that are ideal for gold stocks to finally take the lead in this bull market.
Do the charts for these gold stocks agree?
Below, is a chart of the HUI:
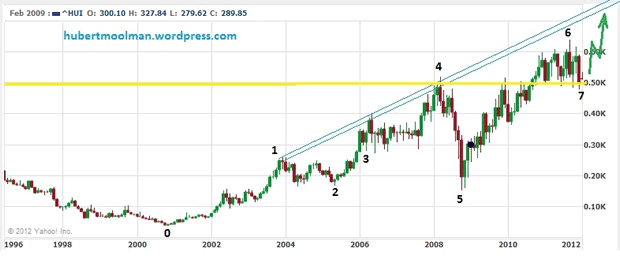
The HUI appears to have bottomed, and is currently embarking on a massive rally. The yellow line should be good support, should price fall back again. Buying close to the yellow line would also be a good long-term entry point. Please note that the green drawn line is just for illustration purpose, it is not meant to show exactly how the chart will play-out.
A scenario for the HUI, which is very likely, is that the HUI follows the example of silver's rally from the $19 level to $49. I think this is very likely, since it seems that the HUI is now in a very similar situation to where silver was in August 2010.
Note that there is more detailed analysis (including fractal analysis) in the Gold Mining Fractal Analysis Report.
For more detailed analysis of gold, silver and the Dow, you are welcome to subscribe to my free or premium service.
Warm regards and God bless,
Hubert
http://hubertmoolman.wordpress.com/
You can email any comments to hubert@hgmandassociates.co.za
© 2012 Copyright Hubert Moolman - All Rights Reserved
Disclaimer: The above is a matter of opinion provided for general information purposes only and is not intended as investment advice. Information and analysis above are derived from sources and utilising methods believed to be reliable, but we cannot accept responsibility for any losses you may incur as a result of this analysis. Individuals should consult with their personal financial advisors.
© 2005-2022 http://www.MarketOracle.co.uk - The Market Oracle is a FREE Daily Financial Markets Analysis & Forecasting online publication.