


Stocks Bear Market Focus Point: Complacency Morphs into a Bull Trap – It’s that time again
Stock-Markets / Stocks Bear Market Feb 16, 2012 - 09:48 AM GMTBy: Garry_Abeshouse

 Like it or not, we are still in an equity bear market rally. In its maturing phase it is ditinguished by six month old upward wedges in key indexes and stocks all quietly edging up into their apexes on declining volume. This is also a time when you would expect to see signs of bullish expectations remerging from the earlier seas of despair. Last week it was an email from an excited technical analysis based equity market newsletter announcing to all, that there are and I quote . . . . “ ‘70 Stocks poised to make Big Moves’, Tuesday's Q1 Stock Picking Session turned into a Stock Picking. Love Fest! Xxx xxxxxx discussed 70 stock trading candidates of all shapes and sizes, along with the reasons WHY they could make big moves”. The date of this email was February 9th 2012. There was also the NAAIM Survey of Manager Sentiment illustrated below.
All these are signs indicating we are fast approaching yet another Bull Trap in equities - after all, how high can you go in the face of a continuing decline in world economic activity.
The NAAIM Survey of Manager Sentiment
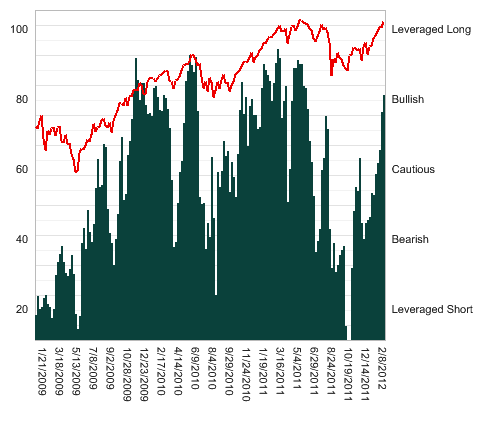
Bull Traps challenge our ability to see through all the media crap, (sorry, financial journalism) and newsletter promotional froth and bubble, so we may better ascertain what the future beholds.
Market tops can be an extremely drawn out process containing a series of peaks over many years, each one a Bull trap. It is all part of the long drawn out unravelling process emanating from the material and financial excesses in our past. In many ways the topping out process of western economies effectively started in the late 1980’s and 1990’s. This was a time when those living in these western economies thought it was a wise move to sacrifice generations of industrial nation building and hundreds of thousands of manufacturing jobs on the altar of consumerism, by exporting these jobs en-mass to SE Asia. Future generations will pay dearly in the Caucasian West for the greed and poor social, economic and political leadership that allowed this to happen.
Over the last 10 years, the topping out process in equity markets has been hidden from most of us by many factors. These include the huge influx of speculative money from banks and hedge funds that has been and still is channelled into high frequency trading. This trading is carefully hidden from sight in the “Dark Pools” of liquidity then often placed off-balance sheet in tax havens across the world. To some extent, extended equity market tops can be maintained, but only as long as access to cheap and/or black money remains available, which can be channelled into currency and equity market trading, Many of these large pools of money are controlled by countries as well as banks and hedge funds, muddying the direction of the underlying short term price movements in currencies and as well as equity markets.
In this situation, the inherent vulnerability of high prices in weakening economic conditions makes the financial markets increasingly susceptible to the traumatic after effects from what I call a “Grey Swan” financial disaster. Where a Black Swan event is usually construed as one that could not be anticipated - such as an earthquake, a Grey Swan event is one where it should have been anticipated – but wasn’t.
The Quadrillion Dollar Question
The big question now is – Will the impending Bull Trap in equities be just “a” Bull Trap or “THE” Bull Trap that leads the equity markets into a major decline? This I suppose, as I have alluded to before, is really the Quadrillion Dollar Question and will be dependent on price moves in the currencies. I expect that when THE Bull Trap occurs, it will be accompanied by a very strong rise in the USD against nearly all other currencies, a strong rise in US T-Bonds and initially anyway, a fall in the price of gold in USD terms. In other words – cash and income producing assets will be king.
Let the trends speak the narrative of the market
As you may have realised by now if you have read my previous commentaries, trend lines are more important to me than the myriad of heavily derived indicators that tend to clutter charts so much these days. I like simplicity and trend lines are simple. They confine price patterns and set limits and by so doing, assist in defining the meanings enclosed within the lines drawn. Trend lines almost need to be a law unto themselves, outlining price patterns seemingly drawn by an unseen hand moving across the page, guided mainly by support, resistance, turning points and congestion areas.
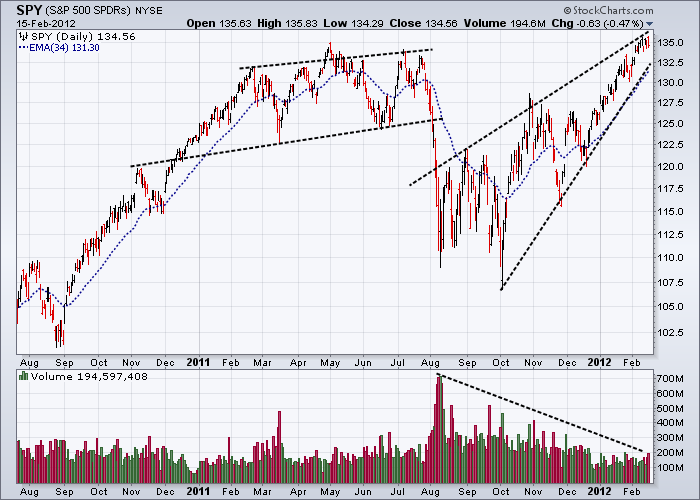
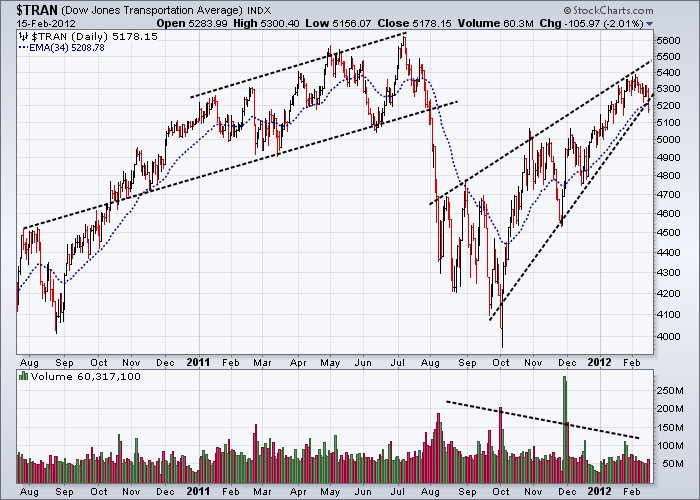
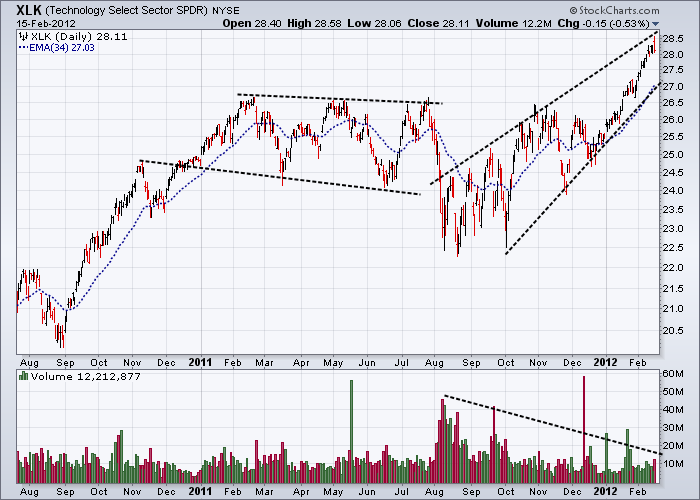
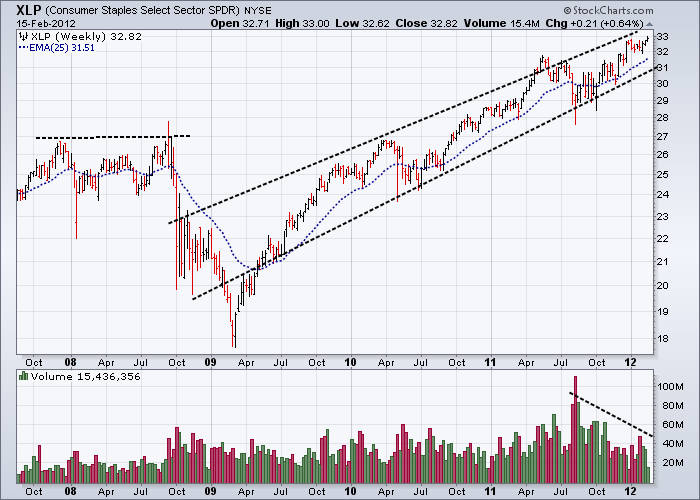
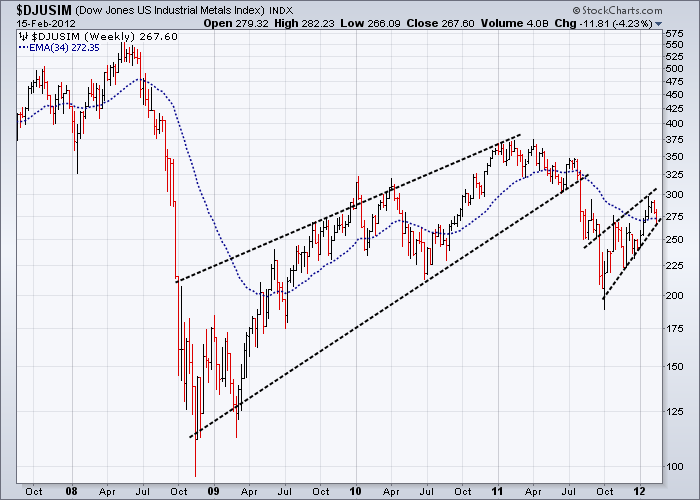
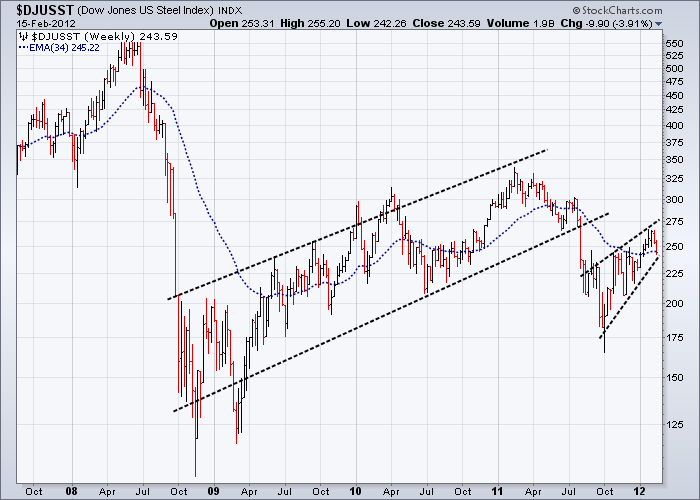
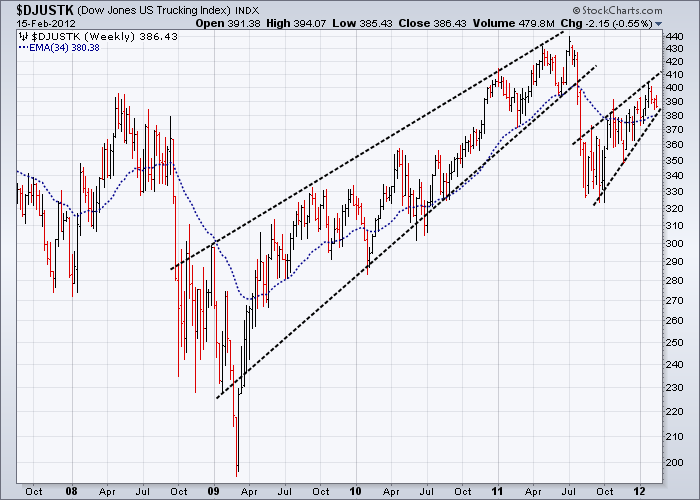
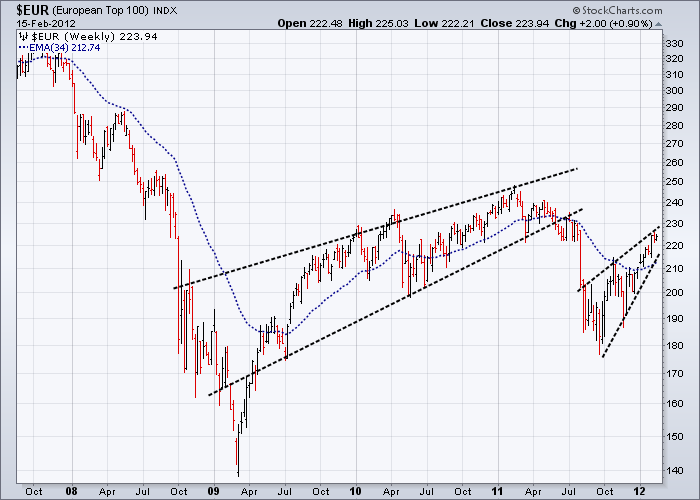
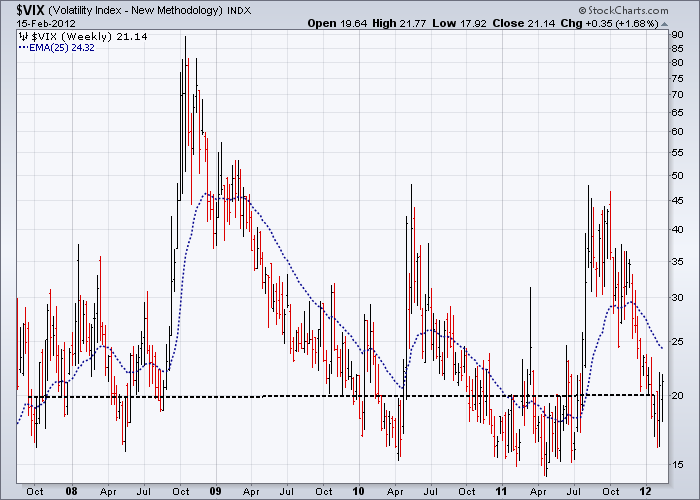
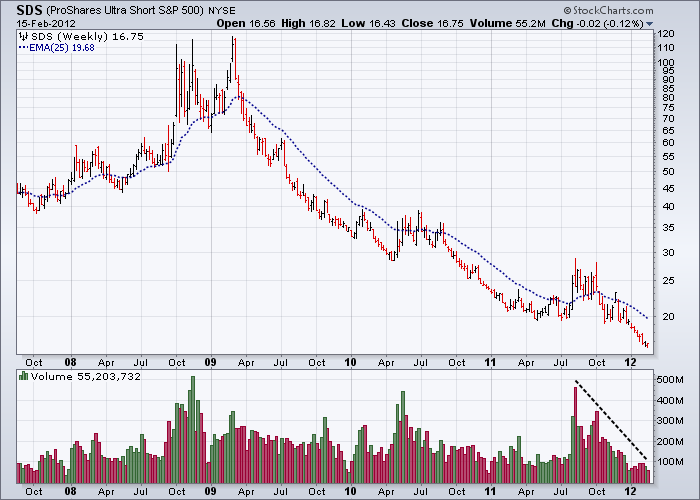
Below is a selection of daily and weekly charts from a broad cross-section of market sectors, mainly from the USA, illustrating the usefulness of trend lines in Technical Analysis. You can clearly see how the lines appear like solid barriers both confining and appearing to actively resist penetration of price movements and by so doing neatly delineating the progress of price movements in the market. Upward wedges are very common in Bear Markets and as long as they predominate in the market place, tend to show that the forces at work still favour the Bears rather than the Bulls. In the charts below, appearing as they do at the mature end of a 3 year old bear market rally, they also indicate the market’s current vulnerability again to a Bull Trap in the near future.
See also my earlier Market Commentary from May 15th 2011 where I proposed there were similar vulnerabilities. Despite being a bit early then, the market weakness at the time was a predictive precursor to the fall in late July and August. At that time, as is now, one of the key stocks to watch was FedEx – not shown here but looks similar to the Dow Transportation Index.
On the weekly charts note the differing positions of the current highs compared to the 2008 highs, then think whether having current highs higher than in 2008 makes any sense and should be something to worry about. If you think it is something to worry about, extrapolate the consequences onto other market sectors. This is what a Bull Trap is all about – the market is only as strong as its weakest link.
Daily Charts
Weekly Charts
Below - Complacency still Rules
Till next time.
Garry Abeshouse
Technical Analyst.
Sydney
Australia
I have been practicing Technical Analysis since 1969, learning the hard way during the Australian Mining Boom. I was Head Chartist with Bain & Co, (now Deutsch Bank) in the mid 1970's and am now working freelance. I am currently writing a series of articles for the international "Your Trading Edge" magazine entitled "Market Cycles and Technical Analysis".
I specialise in medium to long term market strategies.
© Copyright Garry Abeshouse 2012
Disclaimer: The above is a matter of opinion provided for general information purposes only and is not intended as investment advice. Information and analysis above are derived from sources and utilising methods believed to be reliable, but we cannot accept responsibility for any losses you may incur as a result of this analysis. Individuals should consult with their personal financial advisors.
© 2005-2022 http://www.MarketOracle.co.uk - The Market Oracle is a FREE Daily Financial Markets Analysis & Forecasting online publication.