


Time to SELL Overvalued Utility Stocks
Companies / US Utilities Jul 26, 2012 - 02:58 AM GMT

 Recently, I’ve come across several discussions by dividend growth investors as to whether the utility sector is overvalued or not today. Therefore, I decided to look into the sector’s relative valuation as a whole to see what I could find. The only way to efficiently conduct this kind of research is to rely on a broad statistical array utilizing traditional valuation metrics.
However, before I report my findings there are some caveats and clarifications that I feel are very appropriate. First and foremost, I believe that any time you attempt to make broad generalizations about anything; you are by definition applying a great injustice to it. In other words, painting all utilities with the same broad brush is analogous to holding a prejudicial view of human beings based on attributes such as race, creed or color. This is neither rational, nor fair.
Prejudice at the base level means to pre-judge something before gathering the facts. My point is that I believe in evaluating anything, whether it is a person or an asset class, based on individual merit rather than on its membership within a group. In other words, I prefer to judge each individual utility company based on its own fundamentals. I do this because the one pre-judgment that I logically hold is that I will be able to find overvalued, fairly valued and undervalued selections in any asset class or market environment.
Nevertheless, with the above statements made, it also logically follows that after a bull run in any equity asset class, it would be logical to assume that there would be more overvalued selections than fair or undervalued. However, even that may not turn out to be the case, for example, if the stocks were rallying off of a very low base. In this situation, stocks in a given sector could rise and still be undervalued because they had become so undervalued prior to the rise.
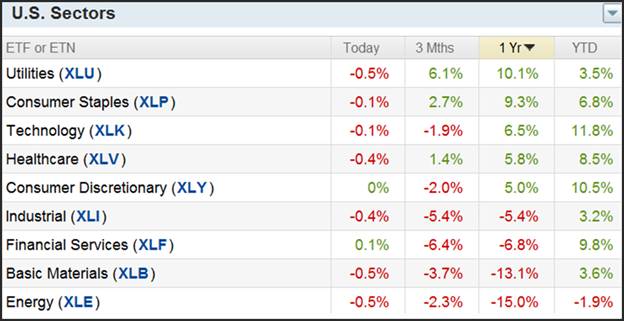
The following report based on the performance of US Sector ETF’s would seem to indicate that the utility sector as a whole has clearly experienced a bull run. The utility sector ETF’s have been the best performing sector over the past year by a rather wide margin over all other sectors except consumer staples.
I found it interesting that both the utility sector and the consumer staples sector are both comprised of companies known for offering attractive dividend yields. Perhaps this is indicative of yield-hungry investors frustrated from the low yields on traditional fixed income assets. Considering that utilities and consumer staples are also associated with higher quality or blue-chip status, risk may also be coming into play. But as previously stated, I struggle to avoid pre-judgment.
Painting Utilities With A Broad Brush
This article will be the first in a series of articles that will look at today’s relative valuation of the broad sector known as utilities. The future articles in this series will drill down into the various more specific classifications of the broader sector known as utilities. The breakdown will look at Western utilities, Central utilities, Eastern utilities, Water utilities and finally Gas utilities.
However, this first article will look more broadly at the sector classified by Standard & Poor’s Corp. GICS code designation 55. This Global Industry Classification Standard (GICS®) was developed by Standard & Poor's and MSCI Barra. GICS consists of 10 sectors, 24 industry groups, 68 industries and 154 sub-industries.
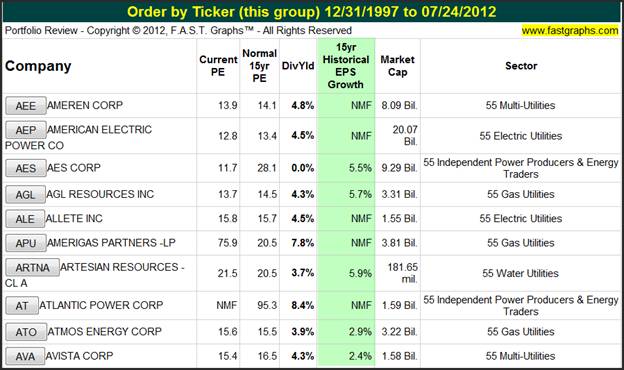
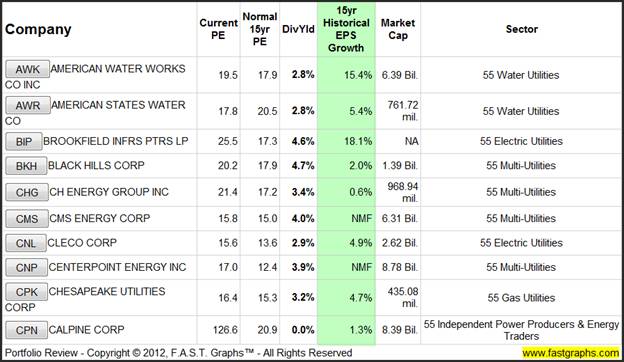
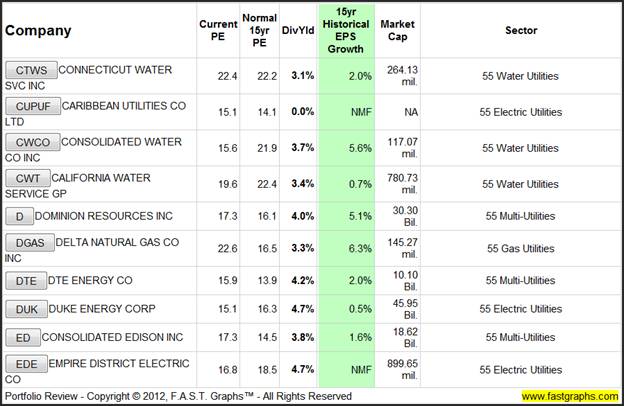
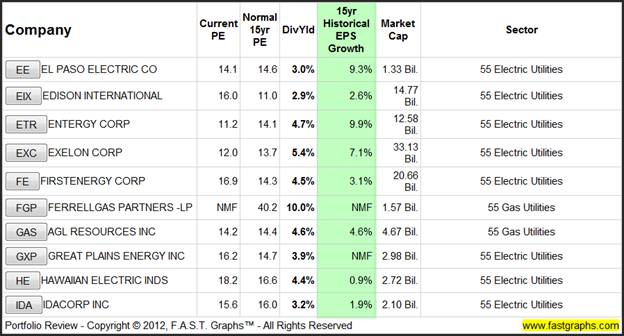
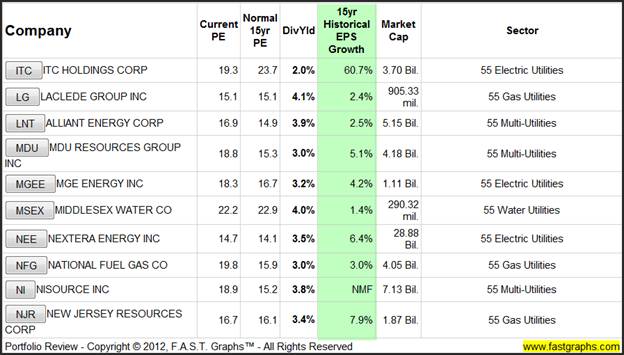
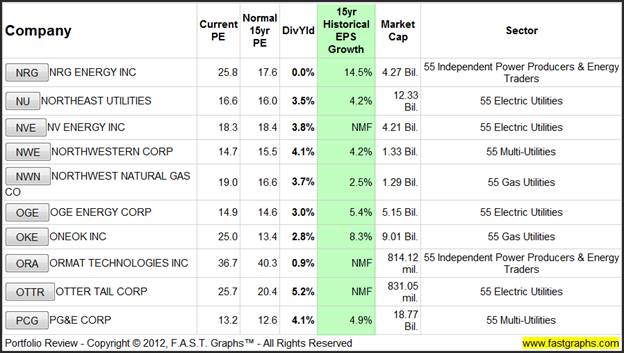
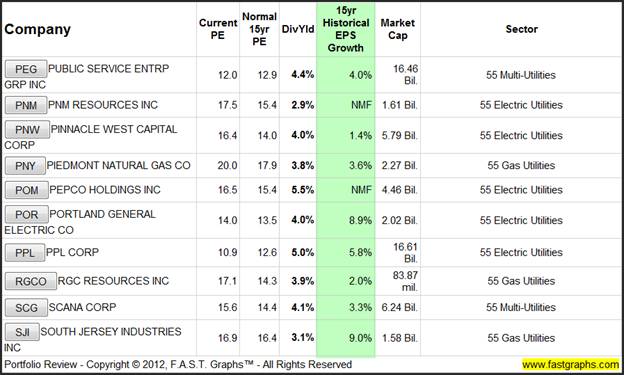
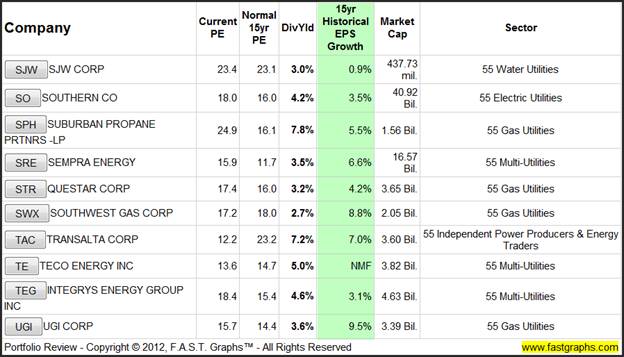
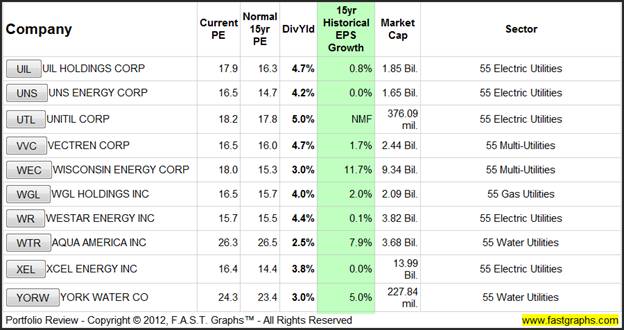
As usual, I will rely on the FAST Graphs™ stock research tool to provide both a general overview and look at the industry’s valuation and a deeper look at specific company examples. The following portfolio review table presents a general statistical look at 91 companies in this broad industry classification (GICS 55 utilities), listed in alphabetical order for the readers’ convenience. For the sake of this first broad-brush look, I encourage the readers to first focus on the 15 year historical EPS growth column (highlighted in green).
There is a general stereotype regarding utility stocks, especially regulated electric utilities, that they are slow growers. As you peruse the historical earnings growth rate column, you would discover that there is a general truth to this previous statement. However, you also discover that there are exceptions to the stereotype. Once again, validating the importance of comprehensive due diligence on the specific business over a more general or statistical analysis.
There are three additional columns that I suggest readers carefully analyze in order to ascertain the feel for the relative valuation of this sector. Look at the current PE ratio in relation to each company’s historical normal PE ratio to get a general sense of whether each company statistically is overvalued, fairly valued or even undervalued. Finally, a quick glance at the dividend yield, if any, on each company can provide an additional first blush sense of valuation. In theory, the higher the yield, the lower the valuation, ceteris paribus.
However, I caution that although this will give a general feeling or sense of valuation, since the “Devils in the details,” these broad statistics can be misleading. Therefore, later in the article I will provide a few specific examples to illustrate this important point. In order to find these examples, I simply clicked on the symbol box and reviewed the earnings and price correlated graphs on each of these 91 companies over the past 15 years.
This took me about 30 minutes, but what I learned about the valuation of the utility sector was astonishing. I will report more detail on my findings in the summary and conclusion of this article. However, until then, I suggested the reader simply review the table below to determine their own sense of whether or not this industry is, on a broad scale, overvalued, undervalued or fairly valued.
Specific Overvalued Examples
As I go through specific examples of overvalued, undervalued and fairly valued utilities below, I caution the reader that I have performed no comprehensive due diligence on any of these companies. This exercise is conducted solely through the lens of the 15 year historical earnings and price correlated stock research tool FAST Graphs™. What this article represents is a more comprehensive look at the general valuation of utility stocks. The idea is that prospective investors can quickly assess whether the necessary comprehensive research effort on a specific company is warranted.
Since this article is focused on valuation, the following tips on interpreting the graphs will be useful:
FAST Graphs™ provide a historical review and instantaneous perspective of how well the business behind the stock has historically performed. This is the orange line on the graph which plots the company’s earnings per share. The PE is the same for this line at any point on the graph and is designated in orange letters to the right side. The blue line is the normal PE that the market has applied.
FAST Graphs™ provide an instantaneous perspective of how the market has historically capitalized or priced the company’s operating results or business performance. To oversimplify, when the price (black line) is touching the orange line, fair value is indicated, when above, overvaluation is indicated, and when below, undervaluation is indicated.
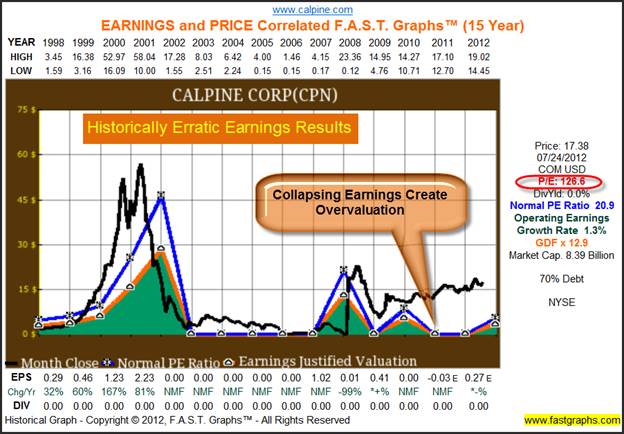
Calpine Corp (CPN)
When looking for overvalued utilities I discovered different nuances of overvaluation. My first example reviews the 15 year earnings and price correlated graph of Calpine Corp, an independent power producer and energy trader. Here we discover overvaluation caused by collapsing earnings. Of course, we also see that earnings and price behavior of this company are not typical of what you expect to find with a classic normal regulated utility. Notice how erratic earnings are, and how there were no earnings from 2002 to 2006. Therefore, in an instant we see a company with a rather checkered operating past.
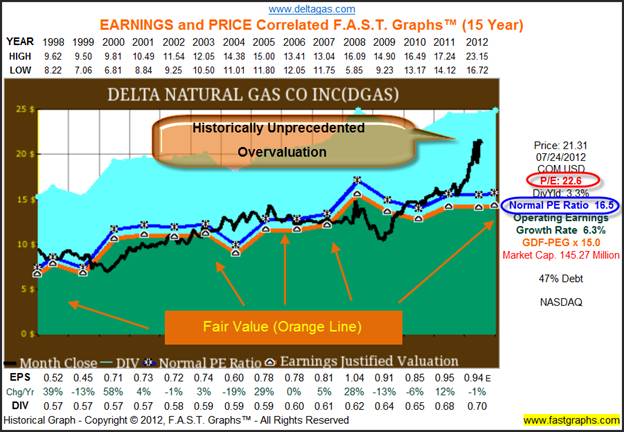
Delta Natural Gas CO. Inc. (DGAS)
Although our second example more classically depicts a regulated utility, recent overvaluation is vividly exposed. For whatever reason, investors have recently become smitten with this company. Inquisitive minds would want to ask why? Unless something has dramatically changed with this business, the current valuation is historically unprecedented.
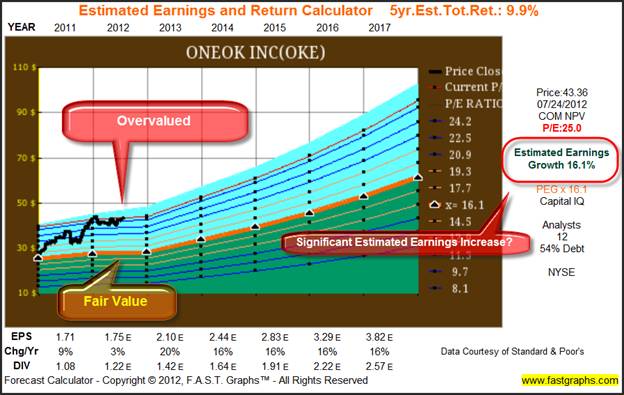
ONEOK Inc. (OKE)
ONEOK is a second example where we see a vivid and undeniable portrayal of aberrant overvaluation. The market has normally capitalized this company at approximately 13 times earnings (blue line) or below. Therefore, today’s PE in excess of 22 is clearly not typical, nor a normal reflection of business results (earnings).
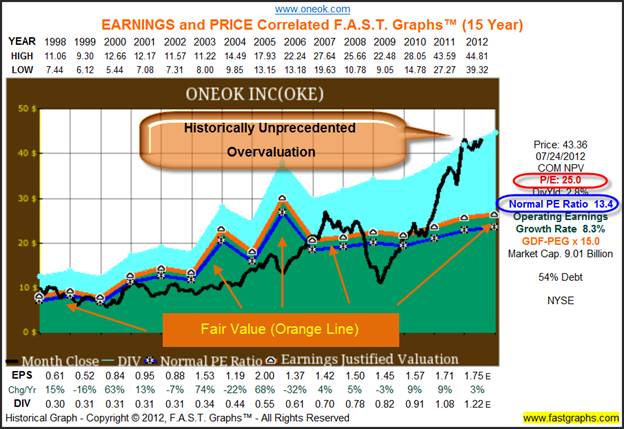
Once again, I remind the reader that everything written here is pre-comprehensive research. However, I would point out that some of the overvaluation can be attributed to analysts expecting this company’s earnings growth rate to accelerate next year and beyond. Further investigation would be needed to determine why they feel that way. However, I would argue that even this higher estimate of future growth does not justify today’s high valuation.
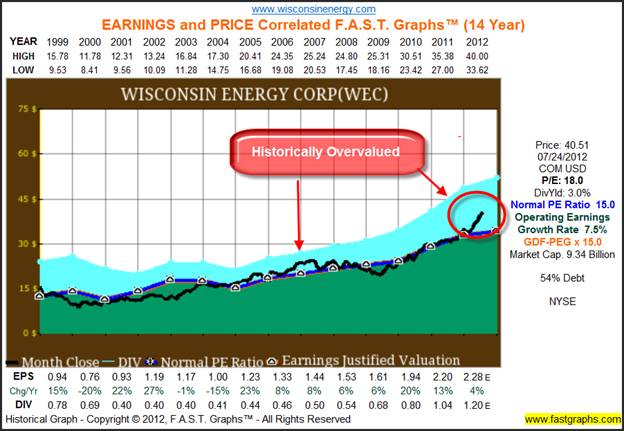
Wisconsin Energy Corp. (WEC)
Wisconsin Energy Corp. has one of the strongest records of earnings growth of any utility I have examined. Moreover, this utility represents the quintessential example of a highly correlated earnings and price relationship. Notice that the normal PE ratio (blue line) and the earnings justified valuation line (the orange line) are virtually identical in this example.
Therefore, it appears crystal clear that this company is currently overvalued. Although overvaluation is not as extreme as it was with the other two examples, we can see that performance suffered for almost three years the last time the company was similarly overpriced.
Specific Fairly Valued Examples
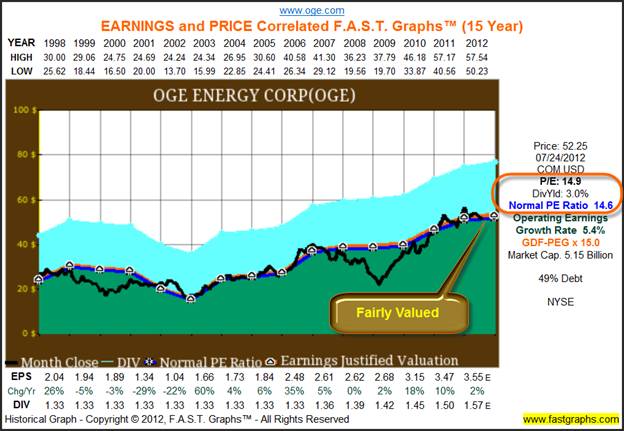
OGE Energy Corp. (OGE)
OGE Energy Corp. provides an example of what I think a typical utility stock looks like. Here we see earnings growth just about 5%, and a stock price that tracks earnings almost perfectly. Consequently, OGE Energy Corp. appears to be fairly valued. Therefore, we can logically expect approximately 5% or so of capital appreciation plus, or 3% dividend yield adding up to approximately 8% per year long-term future return potential.
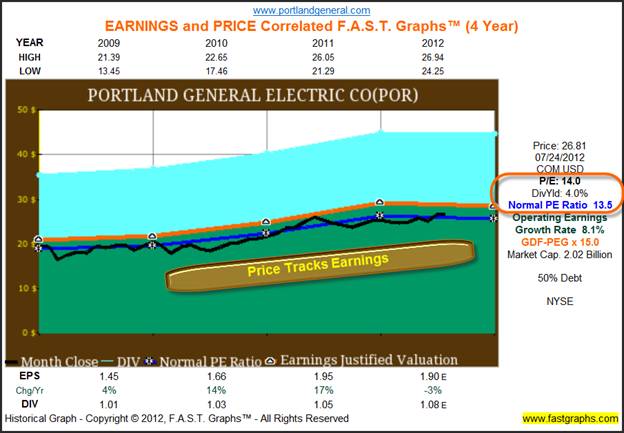
Portland General Electric (POR)
Portland General Electric went public in April 2006 after their existing stock, which was owned by Enron, was canceled. Nevertheless, we see a very strong earnings and price relationship.
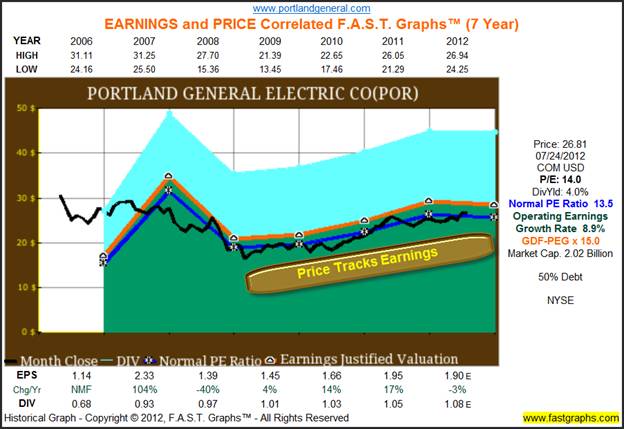
I have added a second graph since year-end 2008 to illustrate how Portland General Electric’s stock price has closely tracked earnings. Mathematically, the market has traditionally priced the stock at approximately 13 ½ times earnings. Consequently, current valuation (PE=14) is close enough to normal to be considered fair value.
Specific Undervalued Examples
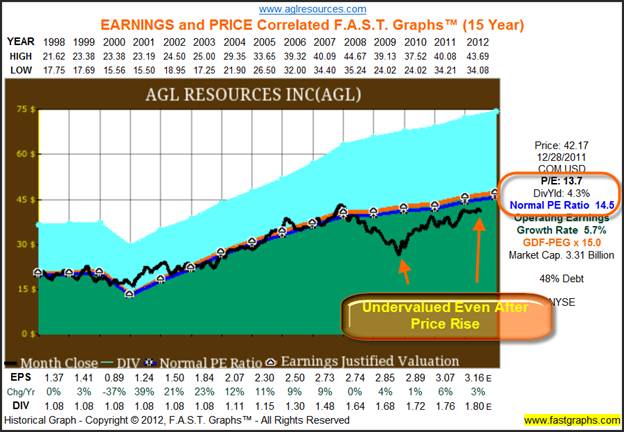
AGL Resources Inc. (AGL)
AGL Resources Inc. has a rather consistent operating record and a highly correlated earnings and price graph. Notice how its stock price has fallen below the earnings line since the great recession of 2008. Although price recovery has been strong since bottoming out, it has yet to reach its fair value. Therefore, we see a classic example that I alluded to earlier, where we have strong price action but still find the company’s stock undervalued.
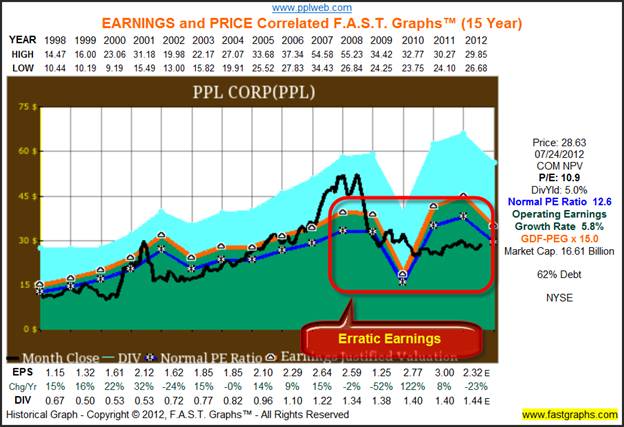
PPL Corp. (PPL)
In this example, notice how erratic the company’s earnings have been over the last couple of years. This might partially explain the current weakness in the stock price. Nevertheless, even when considering current earnings weakness, a case could be made that the stock might be undervalued. However, further research is indicated.
Furthermore, I might add that 18 analysts reporting to Capital IQ expect this company to resume growing at 4 ½% to 5% per annum beyond next fiscal year. If true, this strengthens the case that this company may be undervalued today.
Summary and Conclusions
After reviewing each of the individual companies in this sector, I came away with the following feelings and conclusions. Although I did find several cases of overvaluation, I would only classify a few utility stocks as dangerously overvalued. In other words, many of the technically overvalued companies I saw could be more aptly termed as fully valued or only moderately overvalued. Nevertheless, because these companies typically have lower-than-average growth rates, even a modest overvaluation can dramatically reduce performance to unacceptable levels.
Conversely, I did find an almost equivalent number of companies that I would classify as fairly valued. To be clear, fairly valued does not indicate that they are cheap; instead, it indicates that they are reasonably priced. However, I was hard-pressed to find any that I would be willing to call very undervalued.
Furthermore, and perhaps most importantly, I did discover that much of the recent outperformance can be attributed to many utilities being undervalued a year ago. Consequently, the recent run-up in their prices has brought many of them either back to fair value, or only moderately above fair value. But once again, not enough to encourage me to call them dangerously overvalued.
However, this leads me to repeat an important disclosure about utility stocks. As a general rule, but with exceptions, regulated utilities do not offer much growth of either capital or dividend income. Accordingly, overpaying for companies in this sector even by just a little bit can provide very poor long-term returns relative to the risk taken. In other words, I am suggesting that utility stocks are an equity asset class where paying attention to fair valuation is more critical than it would be, for example, with a stronger growing consumer staple.
In later articles, as I drill down into the subsectors of this broad sector, I intend to elaborate more by examining specific companies. However, there are a few additional general comments about utility stocks that I believe are important for prospective investors to consider. Recently there have been a couple of trends within the industry that could have a material impact on the future investment merits of specific companies. One area is mergers and consolidations, and another is the desire to find alternative sources of revenue outside of the regulated low growth traditional earning streams. This includes international expansion, as well as alternative energy investments.
In conclusion, the utility landscape is changing enough that the future of utility stock portfolios may be vastly different than your grandfather’s were. Therefore, I believe that it is more imperative than ever to focus more on researching individual companies, and therefore, less relevant to think of utilities in general terms. In this same vein, the determination of fair value for utilities should focus more on the future than on the past. In my opinion, this makes the task much more formidable than it has historically been. Therefore, caveat emptor. In Part 2, I will focus specifically on utilities located in the western part of the United States.
Disclosure: No positions at the time of writing.
By Chuck Carnevale
Charles (Chuck) C. Carnevale is the creator of F.A.S.T. Graphs™. Chuck is also co-founder of an investment management firm. He has been working in the securities industry since 1970: he has been a partner with a private NYSE member firm, the President of a NASD firm, Vice President and Regional Marketing Director for a major AMEX listed company, and an Associate Vice President and Investment Consulting Services Coordinator for a major NYSE member firm.
Prior to forming his own investment firm, he was a partner in a 30-year-old established registered investment advisory in Tampa, Florida. Chuck holds a Bachelor of Science in Economics and Finance from the University of Tampa. Chuck is a sought-after public speaker who is very passionate about spreading the critical message of prudence in money management. Chuck is a Veteran of the Vietnam War and was awarded both the Bronze Star and the Vietnam Honor Medal.
© 2012 Copyright Charles (Chuck) C. Carnevale - All Rights Reserved Disclaimer: The above is a matter of opinion provided for general information purposes only and is not intended as investment advice. Information and analysis above are derived from sources and utilising methods believed to be reliable, but we cannot accept responsibility for any losses you may incur as a result of this analysis. Individuals should consult with their personal financial advisors.
© 2005-2022 http://www.MarketOracle.co.uk - The Market Oracle is a FREE Daily Financial Markets Analysis & Forecasting online publication.