


Gold Fractal Analysis Review "YOU AIN'T SEEN NOTHING, YET"
Commodities / Gold and Silver 2012 Sep 02, 2012 - 11:53 AM GMTBy: GoldRunner

 The Fractal Gold chart work is a direct comparison of Gold, today, to the late 70’s Gold Parabola. Thus, “timing” is taken directly from the late 70’s cycle, with price targets created from a combination of the late 70’s Gold price and different technical analysis techniques. We developed a price target back in 2006/ 2007 for Gold to reach the $10,000 to $12,000 range during this Gold Bull. Anything above that range would mean that the “Stagflation” comparison to the late 70’s was exceeded and “Hyper-inflation” would become a real possibility.
During the early stages of the Gold Bull we were able to show Gold’s advance versus the late 70’s on a single long-term chart since similar chart resistance points were evident. This gave us the timing for what we coined in 2007, the projected “Deflation Scare waterfall decline into the 4th quarter of 2008.” Below, is a sample chart from 09-29-07.
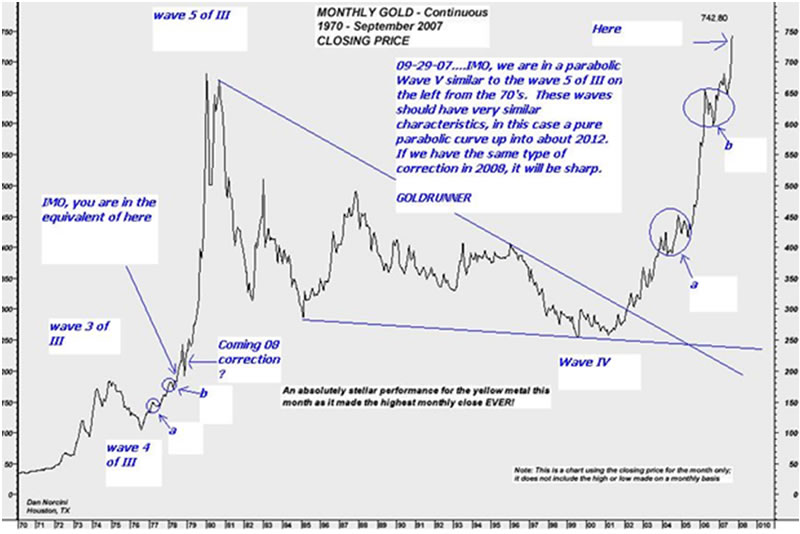
After Gold re-tested the “old 1980 top” in the 4th quarter of 2008, the move to new historic highs left no horizontal resistance on the chart to help guide the way. Thus, in late 2010/ early 2011, we used the time and price relationships from the late 70’s to project Gold’s price advance into the middle of 2011 to $1860- in April adjusted upward to $1920 via normal technical analysis methods. That projection was fulfilled late in the middle 3rd of 2011.
Gold’s next momentum rise off of the late 70’s fractal model projected a price rise up to $3500 to $3600 into the middle of 2012. The fundamentals and the Gold Chart looked good going into March of 2012 compared to 70’s Gold with the Fed printing up over $1.3 Trillion Dollars in swaps to Europe since the Gold Bull is driven by US Dollar inflation/ devaluation. Yet the markets “listened to what the Fed said- not what it did” as it printed over $1.3 trillion Dollars-over double the amount of Dollar printing that shot Gold up from $1300 to $1900 into mid-2011. Thus, the markets have not yet devalued the Dollar based on the huge Dollar printing done since December of 2011 and have not marked up Gold, yet. This leaves a huge amount of Dollar Devaluation for the markets to factor in, with much more to come, that will drive Gold sharply higher. We have often noted that “the Fed owns the psychology of the markets”- the main tool they use to heavily manage the markets. Thus it appears, the Fed has created a sort of delay in the cycle that fits their apparent needs. The above is the reason for the strong support along Gold’s log channel bottom with value investors, smart money, and Central Banks heavily accumulating Gold.
When Gold failed to continue the rise to match the 70’s in March of this year, we turned to a Model of a 3 fan-line formation for subscribers as an alternative potential corrective formation. That model has played out almost to perfection, with the corrective formation recently terminating. This delay in terms of a longer correction fits with Elliott Wave Theory since corrections sometimes extend based on the current psychology- in this case one created via Fed speak to accomplish their needs.
At this point, nothing has changed for the Gold Bull except that a huge Dollar Devaluation will now need to be factored, in- one that will drive Gold much higher. This creates a higher price potential for Gold- one that approaches what “Alf” posted on Jim Sinclair’s site per his Elliott Wave work.
The Dollar Printing since December of 2011 fulfills the need for a pretty constant acceleration of Dollar printing in effect to stave off a true period of deflation. The parabolic printing of Dollars leads to a parabolic devaluation of the Dollar and parabolic Gold. This is all about Dollar devaluation, not so much where the Dollars are going. Thus, the economy will continue to deteriorate creating the need for more Dollar printing, QE. The Fed still needs to print massive numbers of Dollars to cover unfunded liabilities like Social Security, Federal Pensions, Unemployment Insurance, failing loans at Freddie Mac and Sallie Mae, and the list goes on. The Fed’s management of Gold was a necessity to prevent Gold from flying into free-rise before the Federal Government has all of these liabilities on its balance sheet.. It also appears that many Central Banks needed time to accumulate Gold- Gold that will serve as an asset base to “balance the budget” as the price of Gold rises dramatically. The truth is that the paper currency system cannot survive without Real Value Gold for any long period of time.
From here, the fractal charts of Gold in the 70’s saw a dramatic rise to “double the log channel.” Such a potential move looks might sound crazy, but that is what the Fractal Model from the late 70’s suggests. With the 3 fan-line formation in Gold appearing ready to execute, Gold appears ready to fly on the upside into the first half of 2013.
THE MONTHLY LOG GOLD CHANNEL CHART
We can see that Gold has held the dotted blue line channel bottom for the main body of “price”- except for the deflation scare of 2008. The log chart for Gold in the late 70’s is similar. The dotted blue line held support while value investors and Central Banks heavily accumulated Gold.
The upper set of angled blue lines represents a doubling of the log channel. This is the point in the 70’s cycle where Gold made a huge parabolic move on the log chart, and a break-out from a 3 fan-line formation can be explosive and relentless.
Goldrunner maintains a subscription website at Goldrunnerfractalanalysis.com if you are interested. He will be starting a public free newsletter via e-mail during Labor Day week. If you are interested in the public newsletter, you can send an e-mail to GOLDRUNNERBLOG44@AOL.COM.
For the moment,
Goldrunner
NOTE: A link to the Goldrunner subscription service can be found here. If you would like to be added to Goldrunner's mailing list to receive his new and Free newsletter, Goldrunner's Fractal Corner, send an e-mail to GOLDRUNNERBLOG44@AOL.COM.
Please understand that the above is just the opinion of a small fish in a large sea. None of the above is intended as investment advice, but merely an opinion of the potential of what might be. Simply put: The above is a matter of opinion and is not intended as investment advice. Information and analysis above are derived from sources and utilizing methods believed reliable, but we cannot accept responsibility for any trading losses you may incur as a result of this analysis. Comments within the text should not be construed as specific recommendations to buy or sell securities. Individuals should consult with their broker and personal financial advisors before engaging in any trading activities. Do your own due diligence regarding personal investment decisions. In the interest of full disclosure, GOLDRUNNER is personally invested in the Precious Metals sector including various Precious Metals and other individual stocks. GOLDRUNNER reserves the right to modify or eliminate any or all positions at any point in time.
© 2005-2022 http://www.MarketOracle.co.uk - The Market Oracle is a FREE Daily Financial Markets Analysis & Forecasting online publication.