


Primary Stocks Bear Market Crunch Time!
Stock-Markets / Stocks Bear Market Feb 16, 2008 - 10:18 PM GMTBy: Brian_Bloom

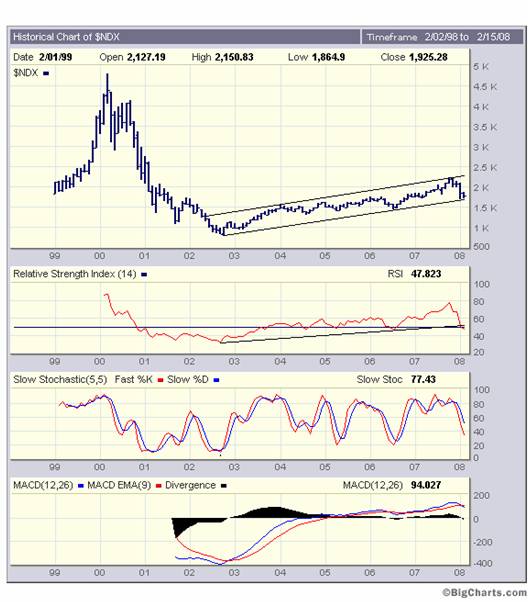
 The monthly chart below (courtesy bigcharts.com ) is showing that the Nasdaq needs to bounce up from here to avoid breaking down.
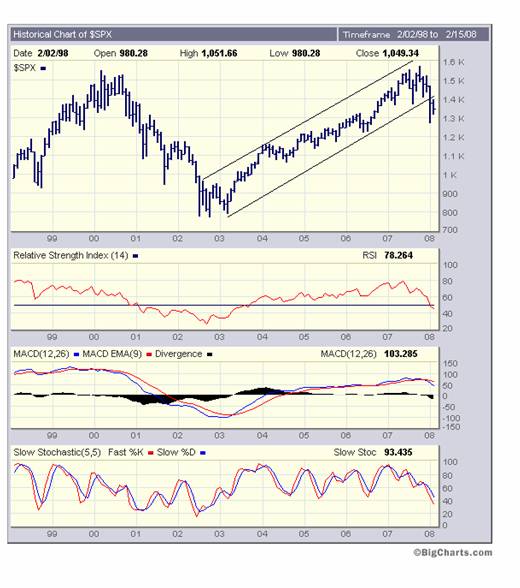
By contrast, to the Nasdaq Index Chart, the $SPX has already started to give sell signals
The Dow Jones Index below is taking a middle path. It broke below its rising trendline, but then bounced back above it.
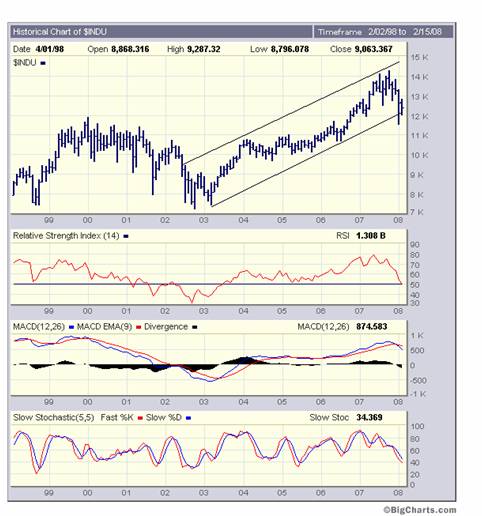
It is very difficult to form a definitive view based on the conflicting and/or non-confirming signals being given by these three charts. Importantly, the MACDs of all three charts seem to be saying the same thing. The blue lines have all penetrated below their red moving average lines and are giving sell signals.
On the other hand, if you have a trading mentality, the slow stochastics are reaching for oversold levels and (if we are in a Primary Bull Market) the markets should be looking to bounce up from here.
If you happen to a “value” oriented investor you could be arguing “Bear Market” from here; if you are “trading oriented” you could be arguing “Bull Market” for the foreseeable future.
For this reason, it becomes critically important to determine whether we are in a Primary Bull Market or whether we are reaching the culmination phase of an upward reaction in a Primary Bear Market.
This analyst is value-oriented in his thought processes. I am now convinced that we are about to enter the next phase of a Primary Bear Market. This is not to say that prices will “collapse” from here. Merely that, on balance, the direction of travel is likely to be south.
Before I go any further I need to admit to having made an error of fact in my previous article entitled “Primary Bear Market” – wherein I stated that “60% of all transport in the USA is dependent on oil”. This was a number which I dredged from memory and, when a reader wrote to challenge me, I looked up the correct number.
In fact, according to Wikipedia, http://en.wikipedia.org/wiki /Peak_oil the statement I had incorrectly remembered reads as follows:
“ This [transport] sector also has the highest consumption rates, accounting for approximately 68.9% of the oil used in the United States in 2006[17],”
I then referred to the Department of Energy's website and discovered the following statement:
“Oil is the lifeblood of America 's economy. Currently, it supplies more than 40% of our total energy demands and more than 99% of the fuel we use in our cars and trucks. The Department of Energy's Office of Fossil Energy focuses on two important concerns over oil - an immediate readiness to respond to oil supply disruptions and keeping America's oil fields producing in the future.”
These two statements, when read together, serve to reinforce the argument I was making rather than negate it. The argument went along the following lines:
The transport industry delivers merchandise (and passengers) across the country. If oil is the lifeblood of the transport industry, and if oil throughput volumes begin to contract, then volumes of transactions in general will begin to contract and the velocity of money will slow down. If velocity of money slows, we will enter a recession.
The evidence is now mounting that Peak Oil has passed, and volumes of oil throughput being processed by the oil refineries in the West may be contracting. Exxon's volumes contracted very slightly last year, and Shell recently announced that its volumes had fallen from the budgeted 3.8 million barrels per day of oil equivalent to 3.315 million bpd
Source: www.dailymail.co.uk/pages/live /articles/news/news.html?in _article_id=511387&in_page_id =1770
Now, whilst part of that results from the shut-out from the Nigerian fields (in which Shell participates, but only to an un-stated proportion) it is reasonable to conclude in light of Exxon's reduced output last year, availability of oil for refineries is now contracting. Either that, or demand is contracting. Frankly, it doesn't matter which. Unless trucks and cars across the USA have suddenly become, on average , (say) 5% more fuel efficient, the probability is that a (say) 5% fall in throughput flows from 5% fewer miles being travelled.
For the sake of discussion, let's assume that volumes have contracted by 5%. In context of the fact that oil prices have been rising, and in context of the fact that transport enjoys a “captive market”, people who drive vehicles for any reason have got two choices:
- Accept the price rise
- Drive fewer miles.
If one takes the trouble to examine Exxon's accounts, one discovers that it has a policy of passing on price rises in full. It typically charges its cost per barrel plus 70% - 75% mark-up.
With this in mind (as an industry-wide practice), the reader's attention is drawn to the simplistic table below, which shows the impact of a price rise from $75 a barrel to $100 a barrel in the markets, and the impact on profitability of an oil business that was previously earning 25% return on revenue, and marks up 75%. In the first case I have assumed sales of 1,000 barrels and in the second case I have assumed that volumes contract by 5%.
| Cost Per Barrel | $75 | $100 | ||
| Marl-Up 75% | $56 | $75 | ||
| Price per barrel | $131 | $175 | ||
| Number of Barrels | 1000 | 950 | ||
| Total Revenue | $131,250 | $166,250 | ||
| Less: Expenses | $98,438 | $103,359 | (*) | |
| Net Pre Tax Profit | $32,813 | $62,891 | ||
| Profit:Sales % | 25% | 38% | ||
| (*) Assuming 5% inflation | ||||
What this table shows is that, even factoring inflation into the annual expenses, return on revenue rises in both dollar and percentage terms, thereby masking the fall in volume throughput.
Those readers who are familiar with Dow Theory will understand that Dow Theory's assessment of the direction of the Primary Trend is based on two underlying tenets:
- Value, as expressed in terms of Dividend Yield, which is a proxy for value. ( At the moment, trailing Dividend Yield on the DJIA is 2.5% and 2.1% on the $SPX (source: http://www.decisionpoint.com /prime/dailycharts/mktsummEARN .html ) Historically, yields below 2% - 3% are associated with Bull Market Tops and yields above 6% - 8% are associated with Bear Market bottoms)
- Both The Dow Jones Industrial Index and the Dow Jones Transport Index must be confirming each other's direction.
Thus, if values are absent, and both indices fall to new lows, then the Primary Direction will be down.
Philosophically, this makes sense, but there are two problems with this logic in today's market.
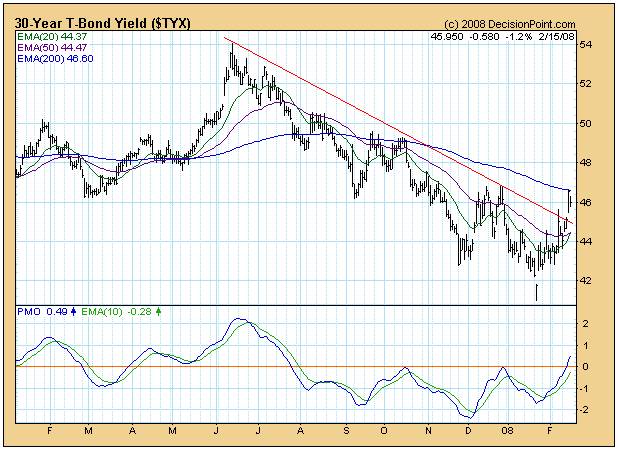
- Dividend Yield is at the low end of the historical spectrum – in an environment where long term interest rates are showings signs of wanting to rise. (See chart below, courtesy Decisionpoint.com )
- We are living through a (temporary) environment where rising profitability within the oil industry (and, by extension, the entire transport industry) is masking falling volumes.
If profitability is artificially high because of the impact of price rises, then this will explain why the Dow Jones Transport Index is stronger than it might otherwise be.
Given that the market should look forward, it is this analyst's view that it is only a matter of time before other analysts begin to understand this particular issue. There will come a point where volume contraction and resulting recessionary conditions puts a cap on price rises in the oil industry; and profitability within the oil and transport industries will begin to contract.
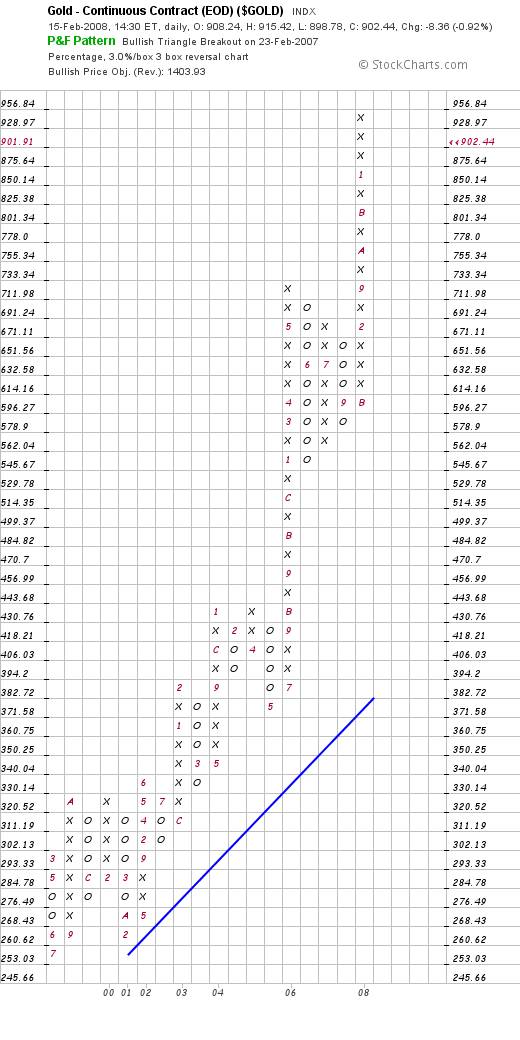
So, this begs the question: “What is the oil price chart telling us about the propensity for continuing price rises?”
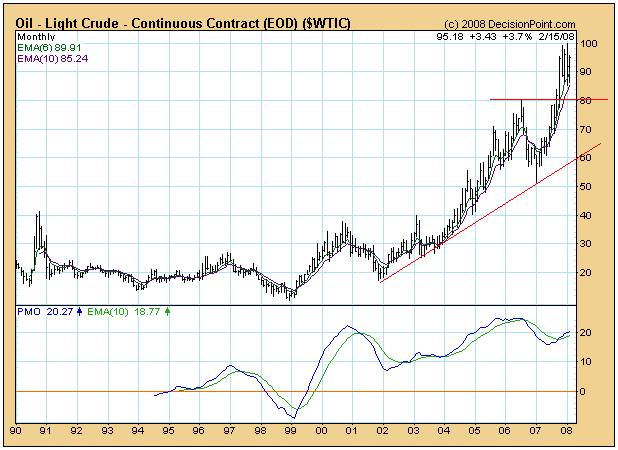
Right now, the signs are very subtle. From the monthly chart above we might find that oil price has some upside potential. But the rising tops in the oil price chart are not confirmed by the PMO – which is showing falling tops (so far).
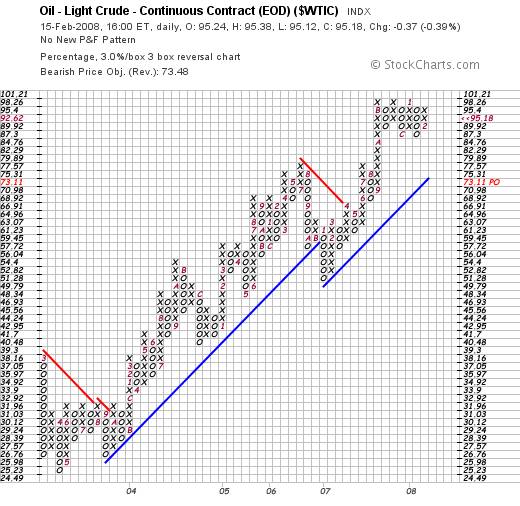
Upside price potential is confirmed by the more sensitive Point and Figure charts, but the “desensitised” (3% X 3 box reversal) Point and Figure chart below (courtesy stockcharts.com ) seems to be showing some significant resistance to further upside beyond the $100 level. Technically, speaking, the price might pull back as low as $73, and still be in a bull trend.
In all honesty, it's too early to make the call, but the fact is that we are facing highly uncertain times – particularly in light of the upside gap in the 30 year yield chart above.
This analyst has been arguing for many months that market forces in the background have been grinding away with an upside bias to long dated yields. The monthly charts reflect the “grand sweep” of the market, and the trends take time to manifest. This upside bias should be very concerning to people who own treasury bonds given the inverse direction of travel of yield and price.
Added to this background upside pressure on long date yields, the fundamentals have, for some time, been pointing to the conclusion that we should be anticipating the emergence of a Primary Bear Market.
Now, the body of technical evidence is also mounting.
That is why this particular analyst has finally concluded that its time to get off the fence and talk with clarity and an absence of ambiguity.
Of course I may be wrong, but I believe we are very close to the re-emergence of a Primary Bear Market and, if it is delayed, it will be delayed by vested interests for the sole purpose of defending the Maginot line in the run-up to the US Presidential elections.
But logic dictates that it cannot be delayed indefinitely. The problem this time around is that the amount of debt out there is excessive; and the amount of counterparty risk on financially engineered gambling instruments is mind blowingly large – by one estimate, in excess of $500 trillion. To get some understanding of the meaning of this number, it is ten times as large as the entire world's annual GDP.
Ultimately, when it comes to solving problems of such humungous dimensions, we will need to think structurally. The idea that Mrs Clinton or Mr Obama or Mr McCain is going to single handedly make the slightest difference to our long term future chances of survival is puerile in its logic. We are going to need to start to think in terms of total overhaul of our social infrastructures on a world-wide basis.
As a starting point we are going to need to face up to the fact that “energy” is what underlies all economic activity and that money is merely the grease for the economic wheel. For more than 100 years, the bankers have been white-anting the financial infrastructure by allowing the money supply to grow at over four times the rate of population growth on a world-wide basis. Right now, the US Dollars in circulation throughout the entire world are less than 2.5% covered by the gold in Fort Knox – assuming that gold is there. “Money” has been thrown around like its confetti, and many people have lost sight of the fact that energy is far more important than money. Without energy and water, there can be no sustainable human civilisation on this planet.
Our entire energy and water management infrastructures are going to need to be overhauled; and this need for overhaul cannot be allowed to be viewed as a profit oriented opportunity over which Private Enterprise may squabble like cackling hyenas. The stakes are too high.
Conclusions
If we are not yet in a Primary Bear Market, the technical signals that are starting to come through are pointing to the conclusion that we are very close.
A Bear Market is, in itself, not “the” problem. It will merely reflect investor perceptions of the emergence of underlying recessionary conditions.
With the historically record levels of debt and risk exposure – per capita – the recessionary conditions will unmask the fact that society's infrastructure has been allowed to erode. This erosion has been a consequence of unethical attitudes on the part of those who should have been focussing on protecting society. Our political structures will need to be reorganised to have tighter checks and balances.
The time is approaching where it will be necessary to contemplate the reorganise our social infrastructures in general. The starting point will be a reorganisation of our energy infrastructure which, in turn, will facilitate a reorganisation of our water resource management infrastructure.
This cannot be done on a country by country basis by Private Enterprise. It has to be done at a co-ordinated government level.
But there are solutions! It can be done!
On a personal level, what do we do?
The chart below (courtesy Yahoo.com ) shows that the gold price may pull back in the short term. It has falling tops, which indicates that some consolidation is to be expected.
This is unlikely to represent a change in Primary Direction. The weekly relative strength chart of gold compared to commodities is showing a downside gap which needs to be covered.
The gold price seems to be wanting to pull back relative to commodities – as part of a technical reaction within a rising trend.
But, in the long term, there are solid reasons to believe that the gold price will rise strongly. Fundamentally, gold is a raw material possessed of extraordinary physical properties which will soon begin to be harnessed for the benefit of all humanity. A recent scientific paper has served to verify the existence of these extraordinary properties.
Technically, gold is also showing extraordinary strength on the long term charts. Investors need to bear in mind that nothing goes straight up or straight down. The next pullback in the gold price may be an exceptional buying opportunity.
By Brian Bloom
Australia
www.beyondneanderthal.com
So far, this analyst has identified four electromagnetic energy technologies which warrant further serious investigation. Whilst many physicists will argue, a priori, that none of these is practical, I believe they may be missing something very important. My editor is currently struggling to complete the editing process of Beyond Neanderthal (in which two of these technologies are presented in some detail) and the publisher is now hoping to publish the novel in April 2008. Please register your interest to acquire a copy at www.beyondneanderthal.com.
Copyright © 2008 Brian Bloom - All Rights Reserved
Brian Bloom Archive |
© 2005-2022 http://www.MarketOracle.co.uk - The Market Oracle is a FREE Daily Financial Markets Analysis & Forecasting online publication.