


Understanding Fractal Waves and Time Warp, MAP Analysis Part 6
Stock-Markets / Cycles Analysis Dec 15, 2012 - 10:17 AM GMTBy: Marc_Horn

 The use of pitchforks as cycle, or wave forks, predicatively on a small scale was proving difficult.
Having watched wave development now for a couple of years it appeared that depending on where a wave fell on the next bigger scale it behaved differently and so I wanted to filter out the noise and went back to the biggest scale in the hope of finding better fork combinations and better understanding wave characteristics.
As a result I have spent a lot of time looking at wave structures. I tested over 20 of the top used indicators as a means of sorting matching wave scale, but all are not only retrospective and have no predictive value what so ever, they do not pick up sub-wave formation. They are just confirmatory signals. I made a few indicators to help sort out pivots, but still the same problem!
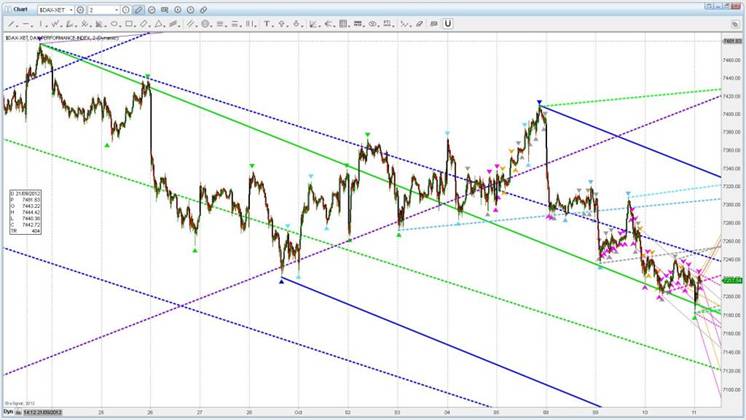
This lead to my revised RULE BASED METHODOLOGY of sorting pivots using pitchforks. However I had to know where we were in time fractal wave cycles to the point where it really does not matter in my lifetime which resulted in me having to go back to the start of the industrial Era. Those that have been following my work received my post How the DAX on the 3 December at 11:24 Confirmed a Long Term Bull Market. I am not sure many people actually understand how this insignificant break can determine the long term bull market.
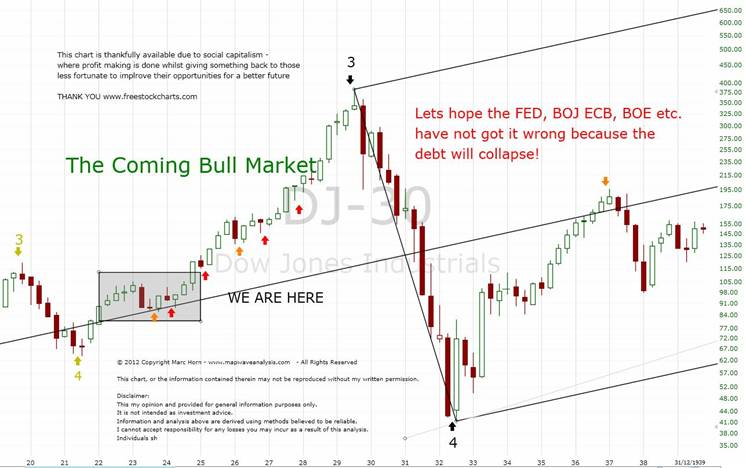
Simply I made the assumption until then that the 2007 was the 309 year cycle top - pivot 5. However due to the fractal structure of MAP Wave Analysis that break once worked back meant that the 2007 top is wave 3 of one fractal wave scale down. So looking at the data I have I make the new assumption that it is quarterly wave 3 top as shown below which follows MAP Wave Analysis rules from the 1932 bottom.

We are in the final quarterly wave up so I am expecting the roaring 20's which was the last quarterly wave 5 as shown below
In order to understand and make your own judgment as to how valid this option is you really need to understand what fractal waves are and how waves form. So I want to develop further understanding assuming you have the basis of MAP Wave Analysis parts 1 through 5. You can find it either on my blog My Analysis or here.
The following reference material I found the best and is invaluable to improve your understanding of not only wave structure, but the global economy and the history of time!!!
Economic Confidence Model Martin Armstrong I would strongly recommend you spend a lot of time on his blog, as I have (but still am only scratching the surface!), on all his works because he has a very unique understanding of how the global economy works and the inter-connectivity of politico-socio-economic interrelationships!
A well presented non Pretcher endless bear market case is presented in Grand Super Cycle Revisited by Tony Caldaro
12,000 YEARS OF ELLIOTT WAVES AND WHAT THIS MEANS FOR THE 21ST CENTURY Joseph M. Miller, Daan Joubert, Marion Butler (2) is also a very interesting read with some interesting view points.
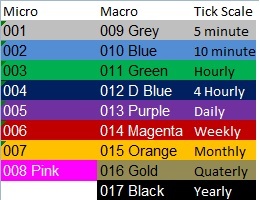
Firstly what are fractal waves? If you look at the chart above you will see that each bigger wave scale is made up of 5 smaller waves, which in turn are made up with 5 more smaller waves, each wave scale being grouped by a single colour. With the DAX break I now use the following wave scales and colour coding as a result of the additional wave fractals.
Quickly summarizing and reviewing the key points.
MAP Waves are a modified Elliot motive wave. Unlike Elliot waves, MAP Waves have defined tops and bottoms and hence overcome the endless unknown possible corrections and possibilities and as a result are much more intuitive to understand and does not have numerous simple and complex patterns, variations, retracement and extension rules etc.
MAP Waves have the following simple 5 wave rules, for up waves pivot 1 must be >= pivot 0 / pivot 2 <= pivot 1 and >= pivot 0 / pivot 3 >= pivot 1 / pivot 4 >= pivot 2 / pivot 5 >=pivot 3 (the opposite for down waves). So unlike Elliot waves MAP Waves look for tops and bottoms, and so highs and lows are used.
Every pivot above was identified using MAP Wave Analysis. As a consequence of the DAX break previously mentioned I have had to add further fractal wave scales so my colour coding has been revised and I am in the process of updating my charts.
Understanding wave structure
I have discussed the basic wave structure (transverse wave) and identification in MAP Analysis Part 1 - Elliot Waves revisited - Motive Wave probabilities - An End to Endless corrections and here will be discussing the little known longitudinal wave.
We are all familiar with simple 2 dimensional sine waves. What goes up must come down (even taxes will once the power structure collapses!! But that is on a much longer cycle!).
Looking at any stock chart we see nothing that resembles this! Why? Because there are multiple wave cycles. As discussed in MAP Waves Part 3 I believe this is a behavioral cycle where actions cause reactions once we reach critical mass of participants which result in pivots - high or lows.
Depending on the scale of the action the reaction will be affected.
For example if you look at the reaction of a Bernanke speech it tends to have a 10 minute pivot scale reaction, sometimes only 5 minutes. If you think about a long term government policy action, eg. coming off the gold standard in the 1970's that allowed unaccountable government spending as a consequence FIAT money (the gold standard is NOT the answer - like anything else it is just another commodity that changes value relative to its demand). We have not yet seen the reaction point to this but history shows us that typically there is an increase in corruption (self interest - lobbying or bribery whatever you prefer to call it), erosion of personal freedoms fought for by our forefathers (think surveillance, tax hunts , protectionism) and decay from inside as those in power do whatever they need to in order to stay in power (think Arab Spring, PIGS riots in European periphery, Occupy movements).
So using my fractal wave model I am following at least 8 wave scales, but sometimes up to 13! As each cycle has a different amplitude and frequency we need to add these at any point in time to see the resultant wave, as shown in the simplified example below.
You can see that the resultant wave bears no correlation to either, and note that the resultant wave may be zero or double, despite a peak in either of the colliding waves!
However if you look at any stock chart any kid can tell you there is no correlation! It certainly looks better than the simple sign wave!
Time to reprogram and look with an open mind otherwise we will just repeat mistakes: our own, our parents’, multi-generational and societal.
Martin Armstrong (p60) has the best description of wave shape and explains a lot as to why waves are not nice simple sine waves (transverse waves), but are longitudinal waves:
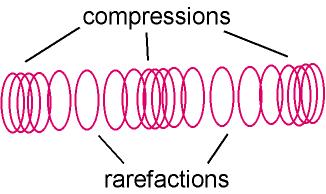
This was a pattern that I had recognised from much watching of price action on charts, and looks like this:
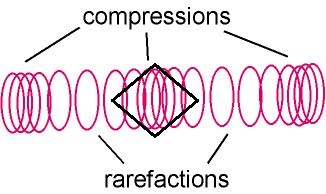
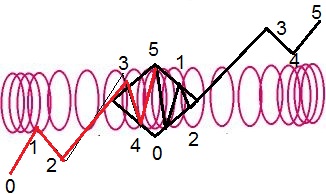
Martin Armstrong talks about the building of intensity of waves so if we relabel our waves as follows it highlights what he describes:
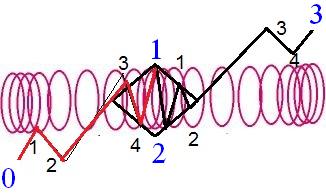
This shows what fractal waves are - waves within waves, building in power.
Can we see this over the long term? Looking at Martin Armstrong's reconstructed chart:
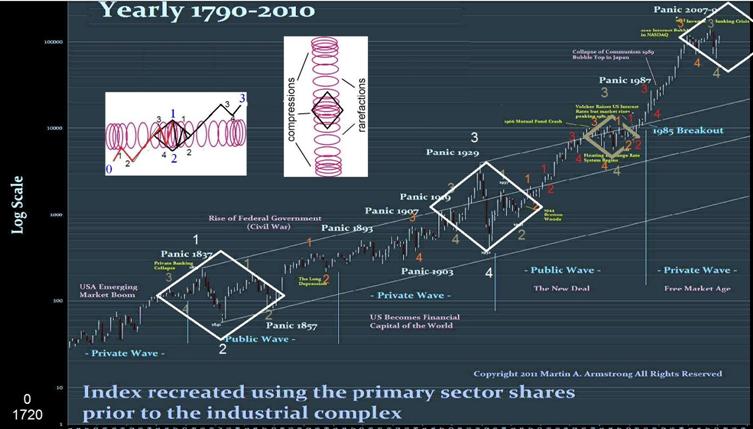
Those people who think pattern recognition is a waste of time maybe it is time to take the blinkers off - one man’s terrorist is another man’s freedom fighter. Keep an open mind. Knowledge is progress if we are not to repeat the mistakes of the past!
One final thing about wave formation is the effect of time. Below is a more detailed look at the current 5th wave from the end of the 1929 correction:
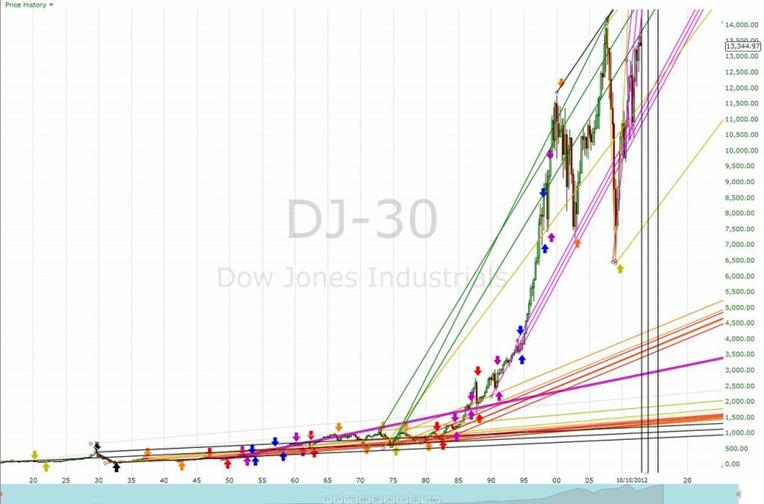
This really looks like a total random method of pivot selection.
However welcome to time warping! I heard about it, read a bit but way over my head.... but Martin Armstrong's chart made sense to me and then I noticed the time warp..... log scale!!!!
Unfortunately I do not have the starting point of the cycle but I think the picture is clear:
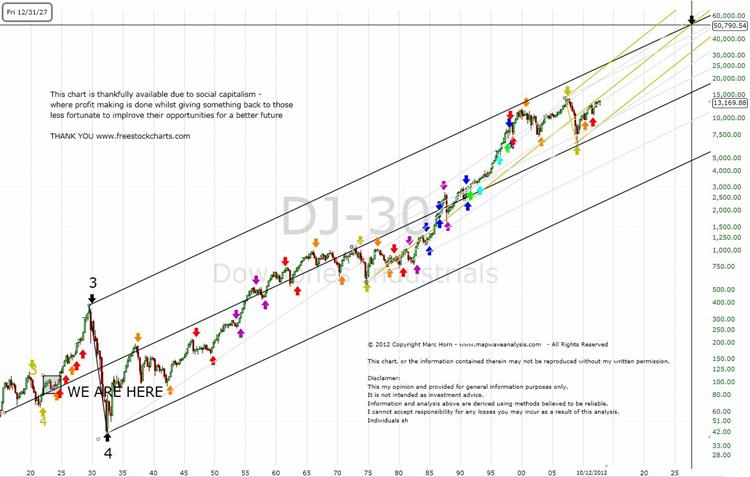
This later long term count is my current preference, as the count approximates Martin Armstrong's fractal structure of time of 6 8.6 year cycles making up one 51.6 year cycle, of which 6 make up the 309.6 years cycle, where each colour represents a different time cycle, or the way I look at it waves within waves.
Below I have compared my wave counts to that of Martin Armstrong's ECM (another rules based system) 1200 years... and Tony Caldaro's counts
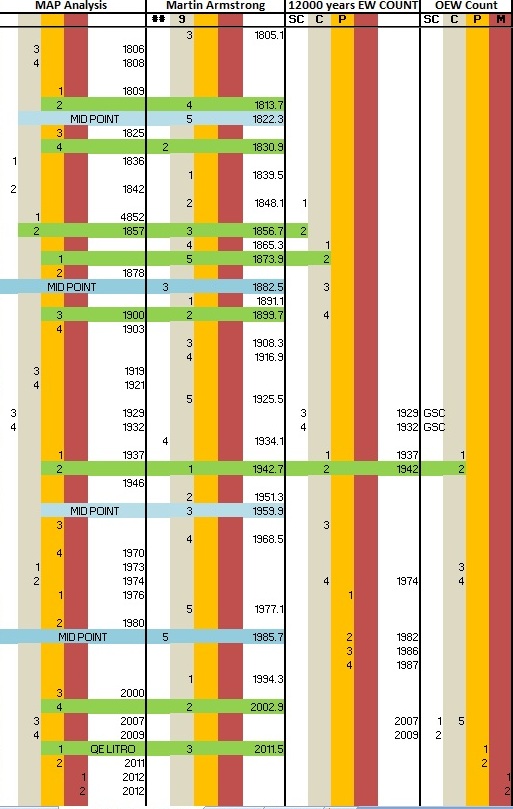
EW wave counts are visibly random was the first conclusion I reached when I coloured them up.
Out of 6 of Martin Armstrong's 51.6 year cycle waves 3 have fallen within 3 fractal wave level midpoints on my largest wave scale. That is not coincidence.
MAP Wave Analysis, unlike Elliot Wave and Andrews Pitchforks are a systematic methodical rule based approach, details of which can be found either on my blog or here on The Market Oracle and data is archived and updated in a format that is traceable as shown in this SPX update, so that the system can be improved and used as a learning model. Additionally investors can evaluate its effectiveness when making investment decisions.
Click here to follow your duty of Use and copyright is described therein.:
Probabilities are derived from the MAP Analysis methodology described therein,
Click follow on my blog to receive regular FREE market updates and discussion.
For other articles published click here
For more information of how I do what I do http://mapportunity.wordpress.com/ . Comments and discussions very welcome!
The statements, opinions and analyses presented in this site are provided as educational and general information only. Opinions, estimates, buy and sell signals, and probabilities expressed herein constitute the judgment of the author as of the date indicated and are subject to change without notice.
Nothing contained in this site is intended to be, nor shall it be construed as, investment advice, nor is it to be relied upon in making any investment or other decision.
Prior to making any investment decision, you are advised to consult with your broker, investment advisor or other appropriate tax or financial professional to determine the suitability of any investment.
© 2012 Copyright Marc Horn - All Rights Reserved Disclaimer: The above is a matter of opinion provided for general information purposes only and is not intended as investment advice. Information and analysis above are derived from sources and utilising methods believed to be reliable, but we cannot accept responsibility for any losses you may incur as a result of this analysis. Individuals should consult with their personal financial advisors.
© 2005-2022 http://www.MarketOracle.co.uk - The Market Oracle is a FREE Daily Financial Markets Analysis & Forecasting online publication.