


Stock Market Uptrend Continues
Stock-Markets / Stock Markets 2013 Feb 03, 2013 - 03:28 PM GMTBy: Tony_Caldaro

 Despite the FOMC meeting, a negative Q4 GDP, the monthly Payrolls report, and a number of other economic indicators this market was not volatile at all. The entire range for the week was SPX 1496-1514, a bit more than 1%. For the week the SPX/DOW were +0.75%, and the NDX/NAZ were +0.95%. Asian markets gained 1.3%, European markets lost 1.6%, and the DJ World index gained 0.7%. On the economic front positive reports outpaced negative reports 12 to 5. On the uptick: durable goods orders, the Chicago PMI, ISM manufacturing, Case-Shiller, construction spending, personal income/spending, the payrolls report, the ADP index, consumer sentiment, auto sales, and the WLEI improved. On the downtick: pending home sales, consumer confidence, and Q4 GDP, plus the unemployment rate and weekly jobless claims rose. Next week is a much lighter week with only five economic reports with ISM services and Consumer credit highlighting the week.
LONG TERM: bull market
Our long term bull market scenario continues to unfold as both the SPX/DOW made new bull market highs this week. In fact, the DOW is less than 1.5% from its all time high in 2007, while the SPX is about 4% below. The OEW long term count, as well as our Secular cycle work, continue to suggest a Supercycle wave 2 low was made in March 2009 at SPX 667. And, the next multi-generational Supercycle bull market has been underway since that low. Supercycles unfold in five Cycle waves. Cycle wave [1], this bull market, began in March 2009 and will probably top in Q4 of this year. After that a Cycle wave [2] bear market will likely last one to three years and wipe out about 45%, or so, of market value. Until then the bull market continues.
Cycle wave bull markets unfold in five Primary waves. Primary waves I and II completed in 2011 at SPX 1371 and 1075 respectively. Primary wave III has been underway since that low. Primary wave I divided into five Major waves, with a subdividing Major wave 1. Primary wave III is also dividing into five Major waves, but both Major waves 1 and 3 are subdividing into five Intermediate waves. Major waves 1 and 2 of Primary III completed in 2012 at SPX 1422 and 1267 respectively. Major wave 3 has been underway since that low. Within Major wave 3 Intermediate waves i and ii have already completed, and Intermediate wave iii has been rising since the the SPX 1343 Int. wave ii low.
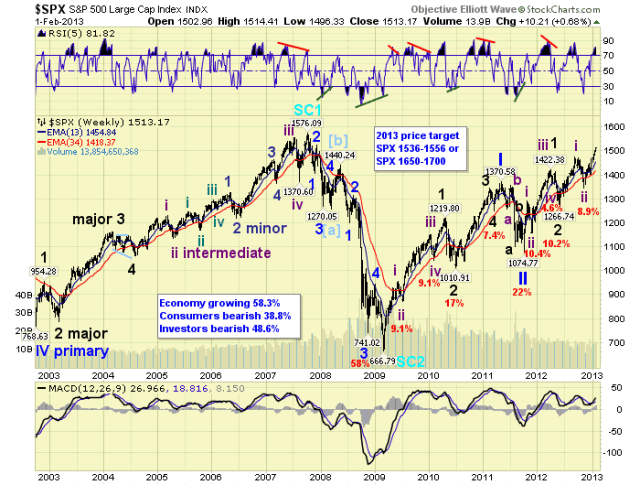
Upon completion of this uptrend, Int. iii, most likely within the range of the OEW 1552 pivot, an Int. iv correction should unfold of about 4% to 5%. Then Int. wave v will complete Major wave 3 in probably Q2, and possibly at all time new highs. Then after a Major wave 4 correction, Major wave 5 will complete Primary wave III probably in Q3. Finally, after a Primary IV correction, Primary wave V should end the bull market in Q4. Eventually we believe the SPX could reach 1700 and the DOW 16,000 before the bull market ends.
MEDIUM TERM: new uptrend highs
The mid-November uptrend, from the Int. wave ii SPX 1343 low, hit new highs this week. The SPX has now crossed 1500, and the DOW 14,000 for the first time since 2007. This uptrend has been a bit tricky at times. However, it continues to work its way higher with a few small deviations along the way. We have been counting this uptrend with the five Minor waves that create a bullish Intermediate wave.
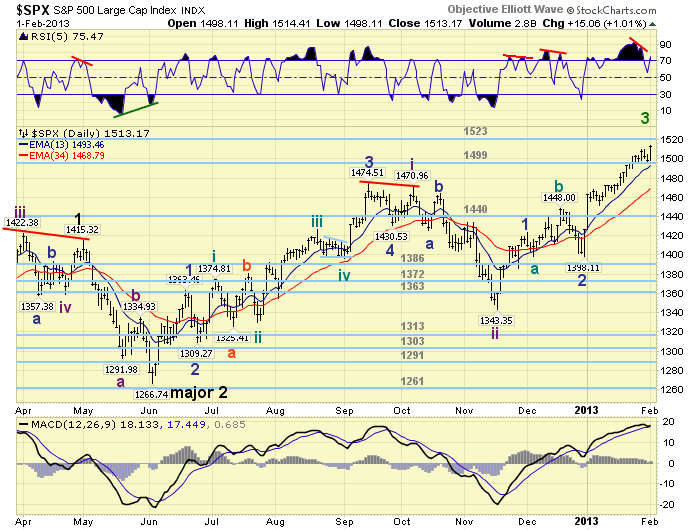
Minor wave 1 completed at SPX 1424. Then Minor wave 2 created a bullish irregular flat ending at SPX 1398: 1398-1448-1398. Minor wave 3 has been underway since that low. Our projection for Minor 3 was for a February high within the OEW 1523 pivot range. Friday started February and the SPX is with two points of that range: 1516-1530. After Minor wave 3 concludes we should see a 30+ point pullback for Minor wave 4. Then another rally, probably into the OEW 1552 pivot range, for Minor wave 5 and the completion on Intermediate wave iii. This is all likely to occur this month. Medium term support is at the 1499 and 1440 pivots, with resistance at the 1523 and 1552 pivots.
SHORT TERM
Short term support is at the 1499 pivot and SPX 1471/75, with resistance at the 1523 and 1552 pivots. Short term momentum rose to quite overbought on friday, after the equally quite oversold condition on thursday. The short term OEW charts remain positive since SPX 1420, with the reversal level now around 1500.
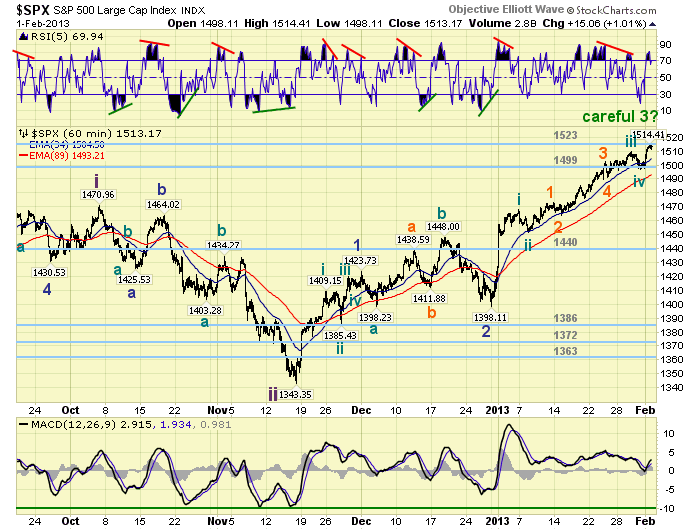
From the Minor wave 2 low at SPX 1398 we have been counting five Minute waves, plus Micro waves and even Nano waves, the third degree lower from a Minor wave. Recently this complexity of subdivisions led to an erroneous potential Minor wave 3 call at SPX 1510. The market cleared away that count on friday and a much simpler count arose out of it. Project, monitor and adjust. We maintain Minute waves i and ii at SPX 1468 and 1452, and now add Minute waves iii and iv at SPX 1510 and 1497. Minute wave iii was quite extended subdividing into five Micro waves: 1469-1461-1502-1491-1510. Micro wave 3 subdivided into five Nano waves: 1473-1464-1485-1476-1502. Minute wave v, from the SPX 1497 Minute iv low, is now underway. Best to your trading!
FOREIGN MARKETS
Th Asian markets gained 1.3% on the week. All indices remain in uptrends but S. Korea continues to weaken.
The European markets lost 1.6%, on large declines in Spain and Greece. All indices are uptrending but these two are weakening.
The Commodity equity group ended mixed and lost 0.3%. Brazil continues to weaken while all indices remain in uptrends.
Thr DJ World index gained 0.7% on the week and is uptrending.
COMMODITIES
Bonds continue to downtrend and lost 0.2% on the week.
Crude remains in an uptrend and gained 1.6% on the week.
Gold has been lagging all the metals, but gained 0.5% on the week. Copper, Platinum and Silver are all uptrending, plus, the GTX commodity index and GPX precious metals index are uptrending as well.
The USD is downtrending again, as expected, losing 0.8% on the week. The EURUSD keeps uptrending, gaining 1.3%. The JPYUSD has been downtrending, losing 2.1%, but is extremely oversold and may reverse soon.
NEXT WEEK
Factory orders kick off the economic week on monday at 10:00. Tuesday: ISM services. Thursday: weekly Jobless claims and Consumer credit. Friday: the Trade deficit. As for the FED. On tuesday FED governor Duke gives a speech at 8:30 in Duluth, Georgia. Then on thursday FED governor Stein gives a speech at the St. Louis FED at 9:30. Best to your weekend and week!
CHARTS: http://stockcharts.com/...
http://caldaroew.spaces.live.com
After about 40 years of investing in the markets one learns that the markets are constantly changing, not only in price, but in what drives the markets. In the 1960s, the Nifty Fifty were the leaders of the stock market. In the 1970s, stock selection using Technical Analysis was important, as the market stayed with a trading range for the entire decade. In the 1980s, the market finally broke out of it doldrums, as the DOW broke through 1100 in 1982, and launched the greatest bull market on record.
Sharing is an important aspect of a life. Over 100 people have joined our group, from all walks of life, covering twenty three countries across the globe. It's been the most fun I have ever had in the market. Sharing uncommon knowledge, with investors. In hope of aiding them in finding their financial independence.
Copyright © 2013 Tony Caldaro - All Rights Reserved Disclaimer: The above is a matter of opinion provided for general information purposes only and is not intended as investment advice. Information and analysis above are derived from sources and utilising methods believed to be reliable, but we cannot accept responsibility for any losses you may incur as a result of this analysis. Individuals should consult with their personal financial advisors.
Tony Caldaro Archive |
© 2005-2022 http://www.MarketOracle.co.uk - The Market Oracle is a FREE Daily Financial Markets Analysis & Forecasting online publication.