Most Popular
1. It’s a New Macro, the Gold Market Knows It, But Dead Men Walking Do Not (yet)- Gary_Tanashian
2.Stock Market Presidential Election Cycle Seasonal Trend Analysis - Nadeem_Walayat
3. Bitcoin S&P Pattern - Nadeem_Walayat
4.Nvidia Blow Off Top - Flying High like the Phoenix too Close to the Sun - Nadeem_Walayat
4.U.S. financial market’s “Weimar phase” impact to your fiat and digital assets - Raymond_Matison
5. How to Profit from the Global Warming ClImate Change Mega Death Trend - Part1 - Nadeem_Walayat
7.Bitcoin Gravy Train Trend Forecast 2024 - - Nadeem_Walayat
8.The Bond Trade and Interest Rates - Nadeem_Walayat
9.It’s Easy to Scream Stocks Bubble! - Stephen_McBride
10.Fed’s Next Intertest Rate Move might not align with popular consensus - Richard_Mills
Last 7 days
US Presidential Election Year Stock Market Seasonal Trend - 29th Nov 24
Who controls the past controls the future: who controls the present controls the past - 29th Nov 24
Gold After Trump Wins - 29th Nov 24
The AI Stocks, Housing, Inflation and Bitcoin Crypto Mega-trends - 27th Nov 24
Gold Price Ahead of the Thanksgiving Weekend - 27th Nov 24
Bitcoin Gravy Train Trend Forecast to June 2025 - 24th Nov 24
Stocks, Bitcoin and Crypto Markets Breaking Bad on Donald Trump Pump - 21st Nov 24
Gold Price To Re-Test $2,700 - 21st Nov 24
Stock Market Sentiment Speaks: This Is My Strong Warning To You - 21st Nov 24
Financial Crisis 2025 - This is Going to Shock People! - 21st Nov 24
Dubai Deluge - AI Tech Stocks Earnings Correction Opportunities - 18th Nov 24
Why President Trump Has NO Real Power - Deep State Military Industrial Complex - 8th Nov 24
Social Grant Increases and Serge Belamant Amid South Africa's New Political Landscape - 8th Nov 24
Is Forex Worth It? - 8th Nov 24
Nvidia Numero Uno in Count Down to President Donald Pump Election Victory - 5th Nov 24
Trump or Harris - Who Wins US Presidential Election 2024 Forecast Prediction - 5th Nov 24
Stock Market Brief in Count Down to US Election Result 2024 - 3rd Nov 24
Gold Stocks’ Winter Rally 2024 - 3rd Nov 24
Why Countdown to U.S. Recession is Underway - 3rd Nov 24
Stock Market Trend Forecast to Jan 2025 - 2nd Nov 24
President Donald PUMP Forecast to Win US Presidential Election 2024 - 1st Nov 24
At These Levels, Buying Silver Is Like Getting It At $5 In 2003 - 28th Oct 24
Nvidia Numero Uno Selling Shovels in the AI Gold Rush - 28th Oct 24
The Future of Online Casinos - 28th Oct 24
Panic in the Air As Stock Market Correction Delivers Deep Opps in AI Tech Stocks - 27th Oct 24
Stocks, Bitcoin, Crypto's Counting Down to President Donald Pump! - 27th Oct 24
UK Budget 2024 - What to do Before 30th Oct - Pensions and ISA's - 27th Oct 24
7 Days of Crypto Opportunities Starts NOW - 27th Oct 24
The Power Law in Venture Capital: How Visionary Investors Like Yuri Milner Have Shaped the Future - 27th Oct 24
This Points To Significantly Higher Silver Prices - 27th Oct 24

Market Oracle FREE Newsletter

How to Protect your Wealth by Investing in AI Tech Stocks

Gold Pattern of Predictability

Commodities / Gold and Silver 2013 Feb 19, 2013 - 09:20 AM GMT

By: Darah_Bazargan

Commodities

Investors have experienced a state of prolonged frustration--where prices are TRAPPED between the upper and lower width of a symmetrical trading band. This is a reversal sequence that is gradual in nature, but unfolds in a horrendous ‘up and down’ affair until a sufficient amount of both time and distance is reached. Prices here regroup, gather strength, and undergo heavy accumulation as both, buyers and sellers, eagerly anticipate a forthcoming directional move.


Word out is that the most current and up to date pattern of GOLD is shaping into a five wave structural decline that in most cases, signifies the completion of a trending move! But there are some circumstances where it’s not impossible for the price to subdivide into six or even SEVEN WAVES before the pattern reaches its culmination; especially in a mature advance or one that stays in effect.

The ACTUAL pattern developing is a contemporary variation of the [seven cycle pivot-wave-structure] - which formed in 2008. The end result that is occurring now- is a six to eight month advance - that will (with certainty) reach a minimum target of 1900, or as high as 2200 in the most bullish case.

The canvas below is a reminder that ALL patterns repeat themselves and, if you will notice in this alphabetical sequence – G completes the developing structure.

GLD- DAILY CHART
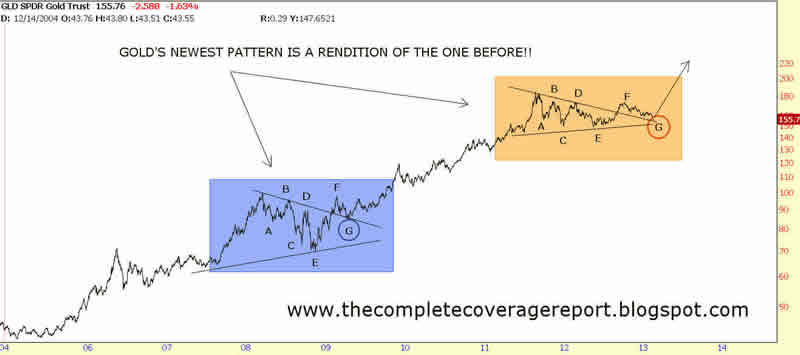

WHY the pattern is reappearing is of no interest, so long as we can observe that it exists! And from the looks of it, the first test of survival is complete and what lies beneath the surface is the muscular structure of one STRONG OX, in the best shape of his life!

Investors want to know the bottom line - and "the end" of this multi-month correction. As late as early March, gold will have reversed course to fulfill its long awaited uptrend.

The CC Report offers two subscriptions- $9.95/month or $100/year. It is well worth the information received.
Darah
www.thecompletecoveragereport.blogspot.com

© 2012 Copyright Darah Bazargan - All Rights Reserved

Disclaimer: The above is a matter of opinion provided for general information purposes only and is not intended as investment advice. Information and analysis above are derived from sources and utilising methods believed to be reliable, but we cannot accept responsibility for any losses you may incur as a result of this analysis. Individuals should consult with their personal financial advisors.


© 2005-2022 http://www.MarketOracle.co.uk - The Market Oracle is a FREE Daily Financial Markets Analysis & Forecasting online publication.


Post Comment

Only logged in users are allowed to post comments. Register/ Log in