


U.S. Housing Market Short Squeeze Shorting Opportunity
Housing-Market / US Housing Sep 06, 2013 - 03:44 PM GMTBy: Money_Morning

 Shah Gilani writes:Everyone knows the U.S. housing "recovery" has been resurrected on slippery ground. But now that we're finally about to slip - big time - no one sees it coming...
Then again, how could they?
The numbers are incredibly misleading...
 According to the Commerce Department, new residential home sales in July fell a whopping 13.4% from their June sales pace. And sales in April, May, and June were all revised significantly lower.
Yet according to the National Association of Realtors, existing home sales (completed transactions that include single-family homes, townhomes, condominiums, and co-ops) increased 6.5%... to a seasonally adjusted annual rate of 5.39 million in July, from a downwardly revised 5.06 million in June.
On the surface, the divergence is confusing. But not when you look below the surface, where the real money gets made.
As you'll see (before anyone else), the housing "recovery" is just one giant "short squeeze."
And you can make a flat-out killing the moment it ends...
Meet America's Biggest Home Buyers
The divergence in sales of new homes vs. existing homes can be explained as a function of three factors: investor interest, pricing, and potential appreciation.
In just the last two years, institutional investors, hedge funds, private equity firms, and real estate investment trusts have raised more than $18 billion and bought more than 100,000 single-family homes.
Blackstone Group L.P.'s Invitation Homes unit has spent over $5 billion buying more than 32,000 single-family homes. They are the largest owner of homes in the United States.
American Homes 4 Rent, which went public last month and is the second-largest single-family homeowner in the United States, has spent $3.4 billion buying up almost 20,000 single-family homes and said in their August earnings call that they're spending $100 million a month buying more homes.
These institutional buyers aren't buying new homes in bulk; they're buying existing homes in bulk... and one at a time.
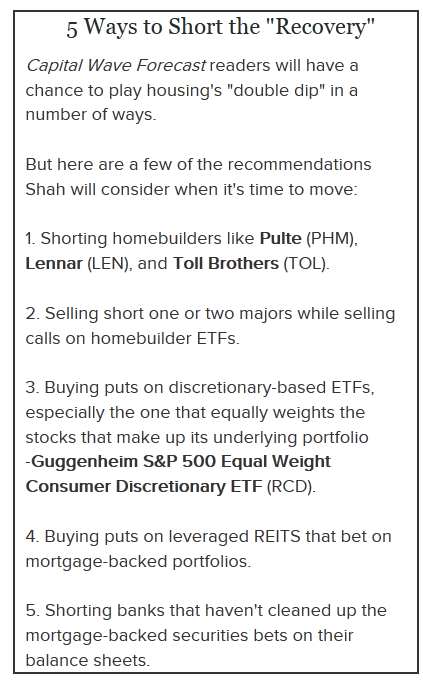
New homes, built by giant national builders like Pulte, Lennar, and Toll Brothers, as well as new homes built by small regional and local builders, are priced according to their cost to build, with hoped-for profit margins added on. Generally, there isn't a lot of negotiating room on prices.
Additionally, new homes are financed by builders' banks who build cushions into their loans. And since loans are "new," they can remain outstanding a lot longer than old loans before banks have to classify them as "non-performing."
That gives builders of new homes greater pricing and staying power. In other words, builders aren't readily discounting their inventories to make them attractive to new home buyers.
On the existing homes' side of the street, there's a lot more room to negotiate...
A Crowd of Highly Motivated Sellers... Who Love Cash
Distressed property owners - banks holding foreclosures, beleaguered individual owners, and short-selling owners (those selling homes for less than their mortgaged loan values) - have all been eager to sell... especially for cash, which institutional buyers readily dangle in front of them.
While institutional investors often pay cash, they are in fact financing the cash they're laying out. With interest rates as low as they are, especially for corporate borrowers able to float their I.O.U.s in the bond market, amassing cash hoards against their stock-based equity collateral (via covenant-lite bond offerings) adds to their massive buying power.
New homes tend to appreciate based on "at-the-market" trends, while existing homes are often perceived as having inherently more room to appreciate. That's because many existing homes were previously valued significantly above current market prices. Homes in neighborhoods that once enjoyed solid appreciation rates but have been deeply discounted are desirable purchases on account of the "bounce-back in price" perception.
That's why existing home sales have held up better than new home sales.
Now let's look at house price appreciation trends, which have been robust to say the least.
Just keep in mind the impact the billions of dollars being applied to the market by institutions is having on pricing trends in the existing home market...
A Dangerous Double Dip Looms
The national median existing home price for all housing types was $213,500 in July, which is 13.7% above July 2012 and marks 17 consecutive months of year-over-year price increases, which last occurred from January 2005 to May 2006.
The median price rose at double-digit rates for the past eight months and is only 7.3% below the all-time record of $230,400, posted in July 2006. Two years ago, the median price was 25.7% below the peak.
New home prices haven't risen as quickly. In 2009, after falling 6.6% from faltering 2008 prices, the median new home price was $216,700. As of July 2013 the median new home price is $257,200, which is an 18% increase over the 2009 price level.
In spite of the recent divergence in the pace of sales and rates of change in sales trends between existing and new homes sales, prices on both streets have risen steadily.
Given the rapid appreciation rates of both new and existing home prices and the outsized impact institutional buying has had on existing home sales price appreciation, unless inventories of new and existing homes drop precipitously, it's not only unlikely that the recovery in housing will continue, but it's likely to peter out and result in a double-dip backward slide.
Why? Housing has risen too far too fast off its floor given trends in economic growth, employment, interest rates, lending standards, mortgage money availability, and consumer confidence.
We're already seeing a back-up in pending sale contracts, refinancings, and new money purchase loans on account of the tick up in rates. Which, on a historic basis, are still very low. If rates continue to climb on the long end of the yield curve, buyers will balk. If rates tick up on the short end of the yield curve, banks will balk at lending. In other words, if the Fed does not continue to engineer a steep yield curve, then purchase money will become tighter and tighter.
There can't be any meaningful recovery in housing beyond the bounce we've seen unless lenders loosen underwriting standards and make loans plentiful.
The back-office mechanics that previously facilitated the robust velocity of mortgage money availability, meaning the ability of lenders to package, securitize, and offload loans from their balance sheets, are still clogged up.
Risk-retention rules pertaining to how much lenders have to retain on their balance sheets against loans they make, in the form of the as-yet unfinished qualified residential mortgage (QRM or QM) rules, will be an impediment to robust lending.
U.S. regulations and Basel rules are still being written, rewritten, and challenged by banks who argue that more stringent reserve ratios, leverage ratios, and risk-asset definitions will be too restrictive and will result in credit tightening. So far, the net result is that banks aren't inclined to flush mortgage conduits with money if they don't know how those loans will be accounted for by regulators.
The bottom line, again:
You can't sustain a robust housing recovery without banks' willing participation.
Then there's the economy, unemployment, and home purchaser confidence.
None of those metrics are encouraging.
While second-quarter GDP growth was revised to 2.5% from 1.7%, the pace of growth remains well below the expected 3% rate economists had projected for 2013.
Unemployment is still stubbornly high and may remain above 7% as the new structural level of unemployment becomes harder and harder to bring down.
Technology and productivity gains have eviscerated middle-management jobs, and Obamacare threatens to reduce the ranks of the fully employed in the future as companies opt for more part-time workers to reduce their mandated contributions under the new healthcare regime rules.
This Is a Classic Short Squeeze
 Last, but certainly not least, future homebuyers are witnessing the evaporation of their own potential equity build-up as rapidly rising prices are squeezing any cushion new buyers would have hoped to enjoy. As that appreciation gets ratcheted out of the market for new buyers, banks will increasingly demand more skin in the game on account of expected or hoped-for equity cushion build-up rapidly disappearing.
The rapid rise in home prics looks to me like a classic short squeeze.
Investors have bid up home prices off the floor so as to make rentals more expensive and force individual homebuyers to pay full price for whatever inventory is on the market.
Once the trade is fully priced and at new highs, on a relative time and appreciation basis, the buying power represented by the bottom-feeding institutional money will dry up, and only homebuyers in a solidly growing economy with greater employment opportunities and bankable confidence will be left to take prices higher and provide forward momentum for the recovery in housing.
As a trader, I say: "Good luck with that."
I'll be watching the trend rollover and will look to short the housing recovery in the not too distant future.
I'll let you know...
Source :http://moneymorning.com/2013/09/06/the-all-american-short-squeeze-no-one-else-sees/
Money Morning/The Money Map Report
©2013 Monument Street Publishing. All Rights Reserved. Protected by copyright laws of the United States and international treaties. Any reproduction, copying, or redistribution (electronic or otherwise, including on the world wide web), of content from this website, in whole or in part, is strictly prohibited without the express written permission of Monument Street Publishing. 105 West Monument Street, Baltimore MD 21201, Email: customerservice@moneymorning.com
Disclaimer: Nothing published by Money Morning should be considered personalized investment advice. Although our employees may answer your general customer service questions, they are not licensed under securities laws to address your particular investment situation. No communication by our employees to you should be deemed as personalized investent advice. We expressly forbid our writers from having a financial interest in any security recommended to our readers. All of our employees and agents must wait 24 hours after on-line publication, or after the mailing of printed-only publication prior to following an initial recommendation. Any investments recommended by Money Morning should be made only after consulting with your investment advisor and only after reviewing the prospectus or financial statements of the company.
Money Morning Archive |
© 2005-2022 http://www.MarketOracle.co.uk - The Market Oracle is a FREE Daily Financial Markets Analysis & Forecasting online publication.