


Stock Market Forecast Unfolding As We Projected, What Is Next?
Stock-Markets / Stock Markets 2014 Feb 05, 2014 - 04:27 PM GMTBy: David_Banister

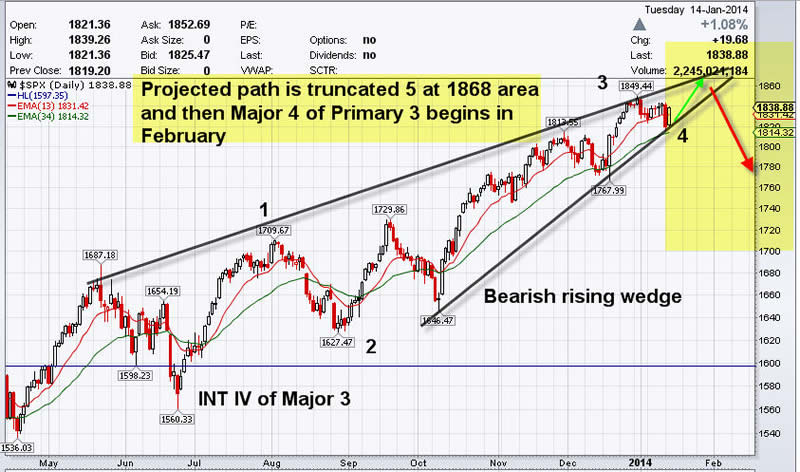
 Back on January 15th we wrote an article and also a elliott wave forecast for both the public and our subscribers showing a likely top at a maximum of 1868 on the SP 500. We said that Elliott Wave Major 3 of Primary Wave 3 would top no higher than that level. In fact, we can go back to September 4th 2013 and we projected a Major 3 high as 1822-1829.
Turns out we were only about 1% off 4 months in advance of projecting that high, and once again we are on track here with Major 4 commencing from Major 3 highs.
Below is the Major 3 chart we sent out on September 12th in public articles and private reports
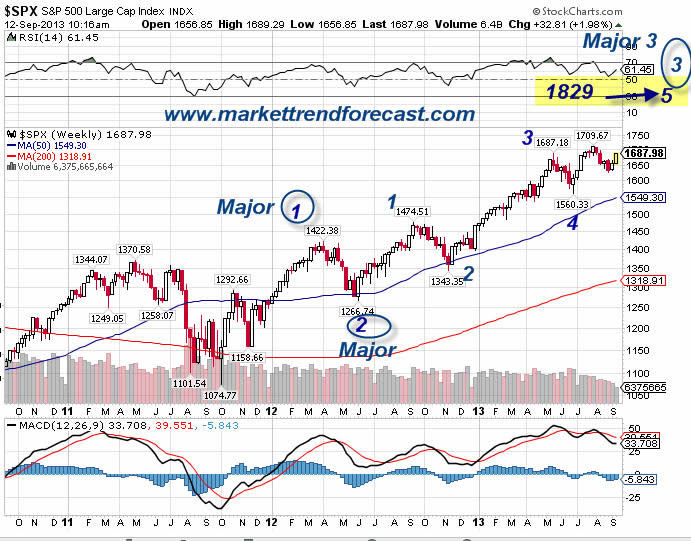
We simply use Fibonacci analysis of wave patterns which are based on human behavioural tendencies that go back centuries. Elliott Wave Theory is often hard to put into practice, so sometimes it gets a bad name. However, a bad steak at a restaurant doesn’t mean you never have steak again right? The practitioner must hone his or her skills over time and work to improve accuracy.
Our view is pretty simple in that the Major wave 3 was 583 points going from 1267 to 1850, the double top.
Below is the chart we did on January 15th in advance of this top:
We now know in hindsight that we topped out at 1850. So what we want to do is simply take the 583 point rally of 1267 to 1850 (major 2 lows to Major 3 highs) and compute a retracement. We use 23.6%, 31.2%, and 38% Fibonacci figures to come up with estimates. Those come in at 1713 on the shallow end of a correction (wave 4) and 1628 on the lower end. (See chart below)
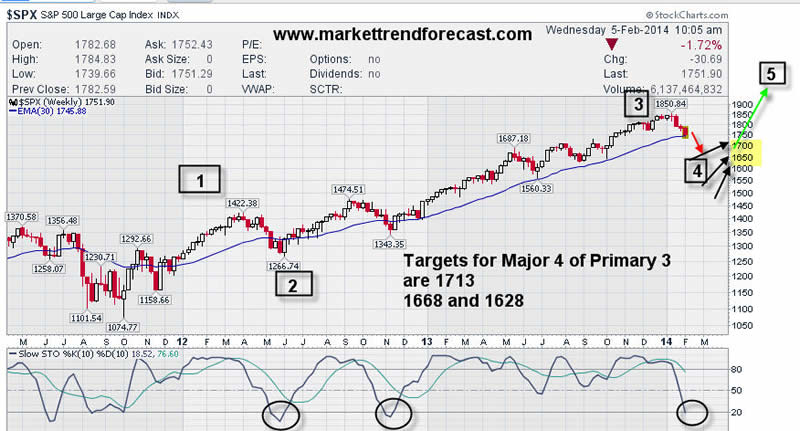
Now, assuming we are on track… once this Major 3 completes we will see a Major wave 5 of Primary wave 3 taking us to all-time highs. This will then complete Primary wave 3 of this 5 primary wave bull cycle and then larger Primary wave 4 corrections will ensue from those highs. We will know we are wrong in our degrees of wave counts if we pierce the 1628 level on the downside. That would indicate Primary 3 topped out 1850 and we are in Primary 4, which is not our current view.
Joins us at www.markettrendforecast.com for regular updates on the SP 500 and Precious Metals.
Dave Banister
CIO-Founder
Active Trading Partners, LLC
www.ActiveTradingPartners.com
TheMarketTrendForecast.com
Dave Banister is the Chief Investment Strategist and commentator for ActiveTradingPartners.com. David has written numerous market forecast articles on various sites (SafeHaven.Com, 321Gold.com, Gold-Eagle.com, TheStreet.Com etc. ) that have proven to be extremely accurate at major junctures.
© 2014 Copyright Dave Banister- All Rights Reserved
Disclaimer: The above is a matter of opinion provided for general information purposes only and is not intended as investment advice. Information and analysis above are derived from sources and utilising methods believed to be reliable, but we cannot accept responsibility for any losses you may incur as a result of this analysis. Individuals should consult with their personal financial advisor.
© 2005-2022 http://www.MarketOracle.co.uk - The Market Oracle is a FREE Daily Financial Markets Analysis & Forecasting online publication.