


Stock Market Seeking New Highs
Stock-Markets / Stock Markets 2014 May 27, 2014 - 02:21 PM GMTBy: Andre_Gratian

 Current Position of the Market
SPX: Very Long-term trend - The very-long-term cycles are in their down phases, and if they make their lows when expected (after this bull market is over), there will be another steep decline into late 2014. However, the Fed policy of keeping interest rates low has severely curtailed the full downward pressure potential of the 40-yr and 120-yr cycles.
Intermediate trend - Probably tracing out an ending diagonal pattern.
Analysis of the short-term trend is done on a daily basis with the help of hourly charts. It is an important adjunct to the analysis of daily and weekly charts which discusses the course of longer market trends.
SEEKING NEW HIGHS
Market Overview
Last week, I mentioned that an important support line was being tested. On the daily SPX chart, it currently stands at about 1874. It starts in mid-February, moves up at a slight angle of about 2.5 points a week, and currently has 7 points of contact (daily closes). It also happens to be an exact parallel to a trend line which connects recent market tops. I believe that it is a key support line which determines the long-term market trend, and that, when decisively penetrated we will have put in place a market top, possibly for the rest of the year.
When we look at a chart of the SPX, there is no question that we are in a period of long term price deceleration which is caused by topping long-term cycles. Since January, the index has been in an upward crawling pattern punctuated by short-term declines which have, so far, been unable to turn the primary trend. This could go on a little longer because we just missed a chance to start an intermediate decline in earnest, and the current rally from 1862 has turned up daily indicators that were on the verge of rolling over.
On Friday, SPX came within a point of its former high, but the bears will have another chance to regain control if the short-term cycles which are due to make their highs in this time frame can exert enough downside pressure before turning up again. We'll find out next week!
NDX has picked up strength and looks determined to resume its former uptrend. However, this determination is not (yet) shared by RUT, XLF and XBD. Also, DJIA has underperformed SPX this past week, so there are a lot of cross-currents which are making the whole picture murky. We'll just have to wait until it becomes clearer.
Chart Analysis
While analyzing the daily SPX chart (courtesy of QCharts.com) we'll look for clues about the market's long term and short term direction.
Even with only a casual glance at this chart, we cannot deny that the index looks tired! The overall formation encased in the yellowish trend lines is forming a wedge pattern which so often forecasts the end of a trend. Ebbing strength is also visible in the MACD which has been losing upside momentum since November of last year. An attempt by price at making a new high since the February low succeeded not only once, but three times with a fourth perhaps on its way. However, each of these new highs has become more and more of a struggle for SPX and it's not a question of if but when prices will succumb to the call of sirens which are urging them to start retreating into the month of October.
While this chart is constructed with daily highs and lows, I have retained the trend lines and their parallels which connect the daily closes. The most important one is the heavy red line which I have drawn across the closes of the three tops from late December to early April. Even though the recent short-term top of 5/11 secured an all-time high, it was only by a fraction and the index pulled back before reaching the red line connecting the previous highs. This is a sign of deceleration or loss of momentum. Now, the index is trying once again, closing on Friday a point below the early May top. Next week should tell us whether or not it will succeed in making a new high.
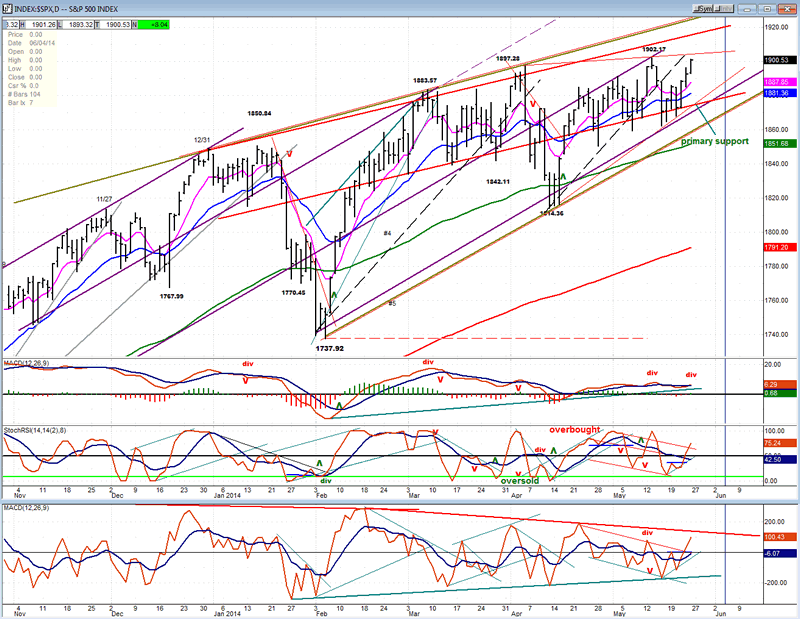
I also want to discuss the other trend lines which are drawn on the chart. I've already mentioned the yellowish lines which are converging into a wedge formation. Let's go back to the heavy red trend line which connects the three tops, and the parallel heavy red trend line which is drawn below it and which is labeled "primary support". I believe that this line, which has, so far, withstood seven attacks by the bears, is the line of demarcation between the current uptrend and the next downtrend of consequence. I am repeating what I said in the Market Overview, but it deserves to be repeated because of its importance.
As discussed last week, the red lines are associated with the long-term trend, the purple lines with the intermediate trend, and the green lines with the short term. Breaching any of these should give us an inkling into what comes next.
A final thought! Wedge formations are sometimes consolidation patterns which eventually resolve to the upside. If this is what we are doing, the next move could take us beyond the top yellowish line and perhaps all the way to the dashed purple line. In this case, the possibility is extremely remote because of cyclical considerations. Another possibility is that wedge formations occasionally end with a brief spurt above the top trend line. But here, this is also considered remote. However, as always, the market will need to confirm its intentions.
A quick look at the indicators shows that the current rally from 1862 has managed to turn the oscillators around from a downtrend to the beginning of an uptrend. If this is a false bullish alarm, they should soon pull back again as prices begin to retrace. I think that we can better see what the prospects are for such a move by analyzing the hourly chart.
On this chart, only the red and purple trend lines from the daily chart have been preserved. All others are hourly trend lines.
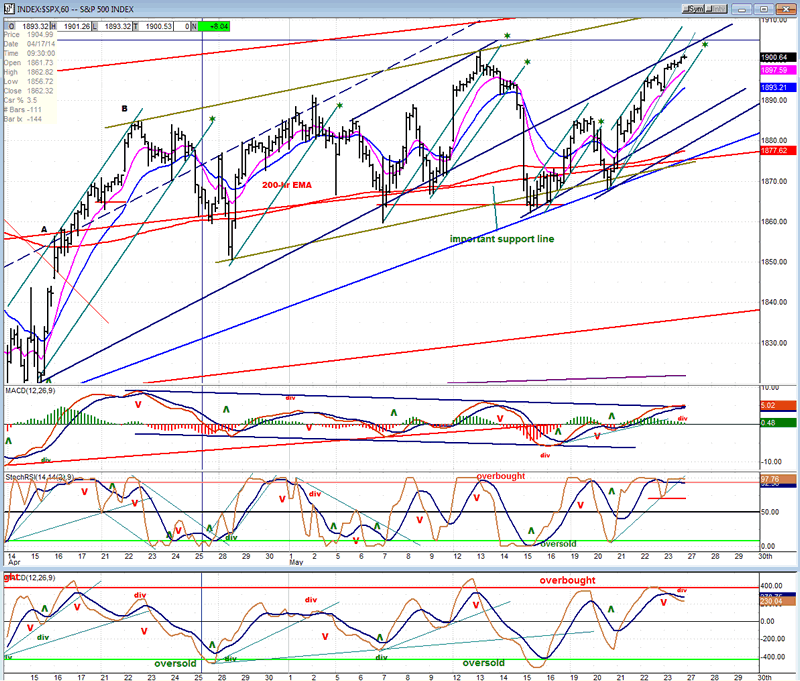
A greenish trend line has been drawn across the last two tops, with its parallel projected from the 4/28 low. Although the latter was slightly penetrated both times, it supported the last two short-term lows and helped prices to develop into the current rally. It is unlikely that the index will reach the top line on this attempt, but it still may after correcting. Note that the index is currently back-testing the dark-blue (closes) trend line which was recently broken! This should provide resistance to the rally's extension.
Assuming that prices reverse around this level, they would first find support from the short, steep, green trend line which is parallel to all the other short green trend lines marked with an asterisk that have their origin as parallels to the line designated A-B. They have provided support to all short-term uptrends since then, and this one is expected to do the same now. This means that when it is broken, it will signal a short-term trend reversal.
What are the odds of a reversal here? Look at the oscillators! They all appear to have exhausted their upward thrust, with the A/D line at the bottom having already reversed. In addition, on Friday, SPX closed in the vicinity or two minor cycle tops! Considering all these negative conditions, it would be surprising indeed if the index did not reverse its short-term trend on Tuesday.
However, whether or not this will turn out to be the beginning of an important decline is another matter! There are six trend lines that can provide support, and that the index would have to break between where it closed on Friday (1900.64) and the lowest trend line at 1874. It would take a lot of sudden selling to overcome this much support! Expecting this to happen is not logical! But close attention will have to be paid to 1) the price level at which SPX does find support, and 2) what kind of a rally it can muster from there. "Sell in May" had no effect on the market! Will the "June swoon" do better?
Cycles
"Looking at the pattern being made by the SPX over the past couple of months, it looks as if longer term cycles are topping and slowly gaining control. Let's allow for a little more time to clarify the picture."
There are two minor cycles which are expected to make their highs in this time frame.
Breadth
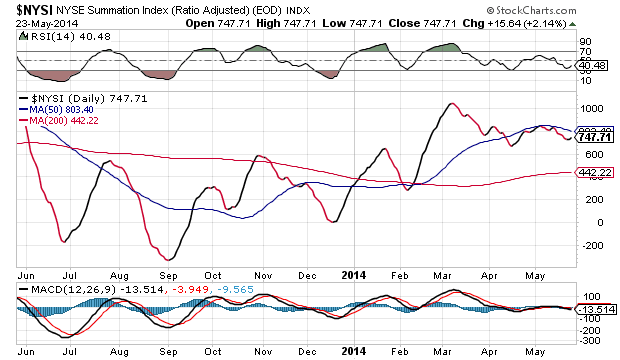
The McClellan Oscillator and the Summation Index appear below (courtesy of StockCharts.com).
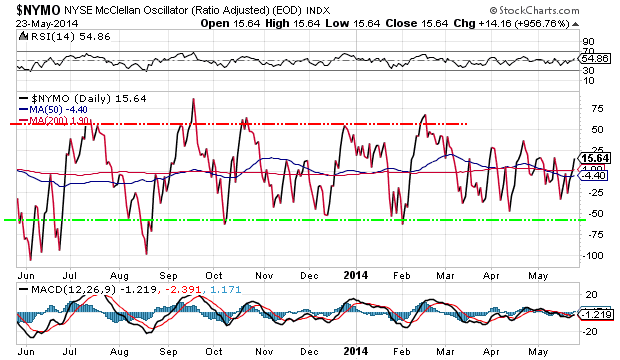
The McClellan Oscillator has turned up before becoming even moderately oversold. This could be viewed as a sign of strength providing it keeps on rising.
As a result, the NYSI has also turned up before making a new low and before its RSI became fully oversold. This too is a sign of strength which should be closely watched for some follow through (or lack thereof!).
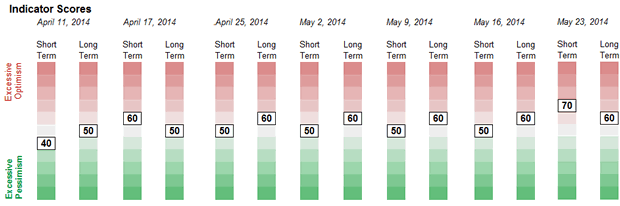
Sentiment Indicators
The SentimenTrader (courtesy of same) long term reading has remained the same for five consecutive Fridays, but the short term has jumped a couple notches to 70, which supports what we saw on the hourly chart: a short term uptrend which is extended and vulnerable to a correction.
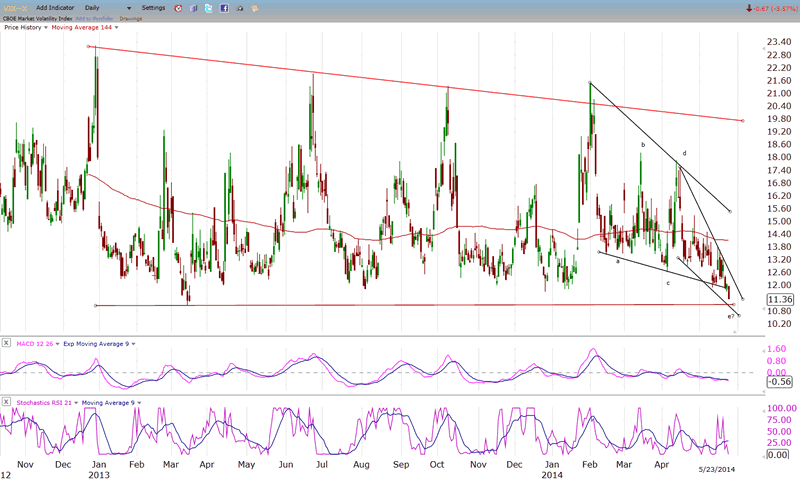
VIX (CBOE volatility Index)
On Friday, VIX recorded its lowest price in over a year! It has also created a pattern of a wedge within a larger wedge! Should this be considered double jeopardy?
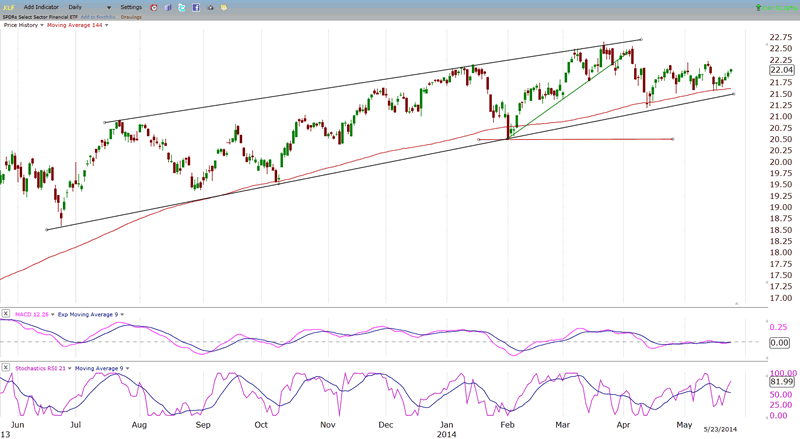
XLF (Financial ETF)
XLF continues to lag behind SPX. While the latter closed near its all-time high, XLF was not even able to overcome its last short-term high. This is negative divergence but XLF has fooled us before by catching up later! Let's see if the divergence is for real, this time.
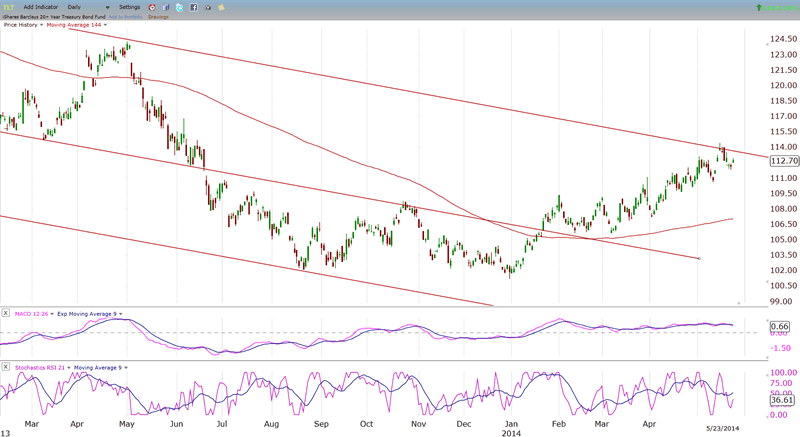
TLT (20+yr Treasury Bond Fund)
As expected, TLT found some resistance at the top channel line but, so far, it has not been pushed back very far. If it has enough momentum, it could go through first, and pull back to the line later to consolidate.
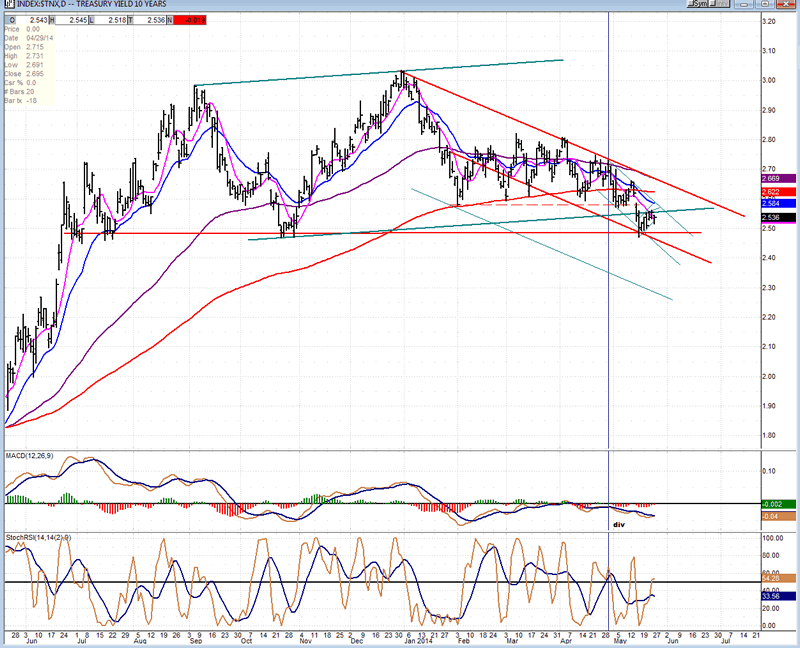
TNX (10-yr treasury yield index)
TNX has started a downtrend which found support at an important level which coincides with the mid- channel line. This could stabilize the downtrend for a while, but if it drops below this level, TNX could continue its decline toward the bottom channel line.
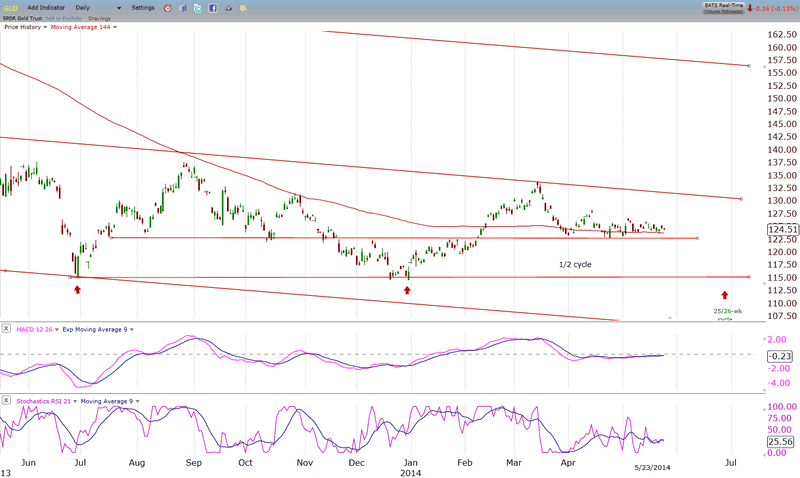
GLD (ETF for gold)
GLD continues to consolidate just above its 200-DMA. By failing to extend its rally from 115 in the up-phase of the cycle, it has created the strong possibility that it will re-test its recent low now that the hard-down phase of the cycle is just ahead.
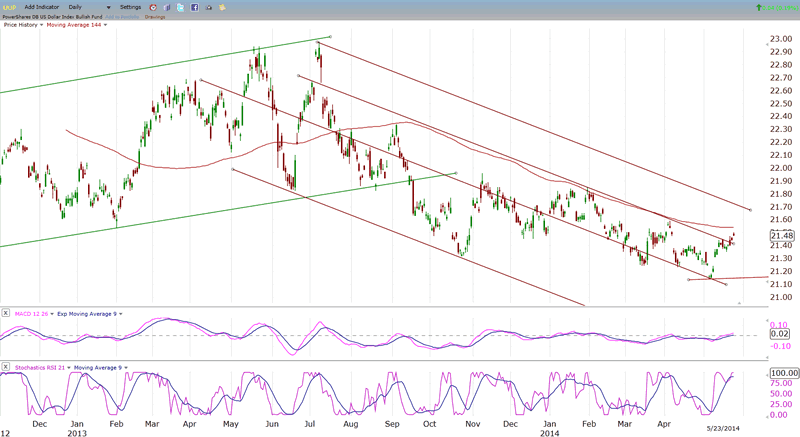
UUP (dollar ETF)
UUP is trying, once again, to rally past its 200-DMA. It should get some assistance from the 25-26 wk cycle high which is due in about a month.
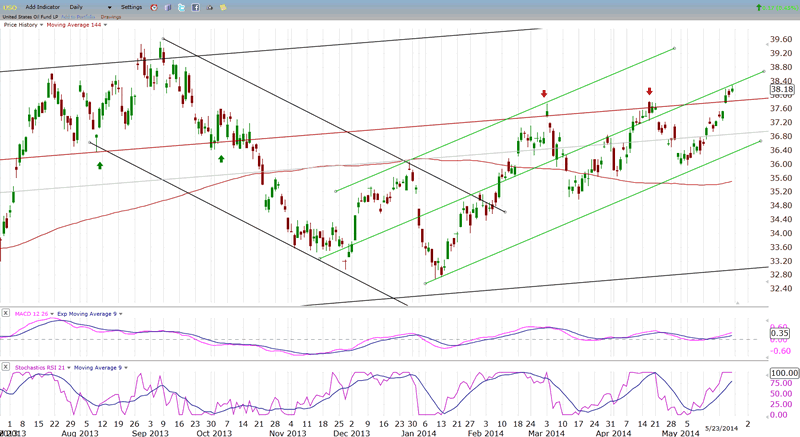
USO (US Oil Fund)
USO is taking adventage of strength in the WTIC to extend its uptrend past a resistance level, but only to confront another in the form of the mid-channel line. If it can overcome this one as well, it will have a chance to challenge the top of the green channel.
Summary
By holding above an important support level, SPX has encouraged some buying to take place. On Friday, it challenged the previous all-time high of 1892 and, judging by the action of the futures over the week-end, it should trade beyond when we open on Tuesday morning.
However, this new all-time high (if it occurs) should be quickly followed by a correction. Since hourly indicators are overbought, some minor divergence is appearing in the A/D, and two minor cycles are expected to make their highs in this time frame.
FREE TRIAL SUBSCRIPTON
If precision in market timing for all time framesis something that you find important, you should
Consider taking a trial subscription to my service. It is free, and you will have four weeks to evaluate its worth. It embodies many years of research with the eventual goal of understanding as perfectly as possible how the market functions. I believe that I have achieved this goal.
For a FREE 4-week trial, Send an email to: ajg@cybertrails.com
For further subscription options, payment plans, and for important general information, I encourage
you to visit my website at www.marketurningpoints.com. It contains summaries of my background, my
investment and trading strategies, and my unique method of intra-day communication with
subscribers. I have also started an archive of former newsletters so that you can not only evaluate past performance, but also be aware of the increasing accuracy of forecasts.
Disclaimer - The above comments about the financial markets are based purely on what I consider to be sound technical analysis principles uncompromised by fundamental considerations. They represent my own opinion and are not meant to be construed as trading or investment advice, but are offered as an analytical point of view which might be of interest to those who follow stock market cycles and technical analysis.
Andre Gratian Archive |
© 2005-2022 http://www.MarketOracle.co.uk - The Market Oracle is a FREE Daily Financial Markets Analysis & Forecasting online publication.