Gold Price Relative To Monetary Base At All-Time Low
Commodities / Gold and Silver 2014 Jun 24, 2014 - 10:15 AM GMTBy: GoldSilverWorlds
 The newest edition of the annual In Gold We Trust report is out. This eight edition goes again to the heart of gold’s value and analyzes the yellow metal as a monetary asset rather than an industrial commodity. The In Gold We Trust 2014 report takes a sober look at the big picture in the monetary system and offers a holistic analysis of the gold sector. It is written by Ronald Stoeferle who is the managing partner of a global fund at Incrementum AG in Liechtenstein, based on the principles of the Austrian school of Economics.
The report discusses in great detail the state of the monetary system. Probably the most important of the ongoing trends is the frightening observation that we arrrived in terra incognita when it comes to our monetary world. This is the result of continuing monetary interventions by central banks around the world. Monetary policy doesn’t work like a scalpel, but like a sledgehammer. Superficially, extreme monetary policy stimulus has calmed financial markets overall. The results, in terms of the real economy by contrast, continue to lag behind expectations.
The significant bubble in paper assets relative to hard assets is illustrated in the next chart. In spite of substantial volatility, global financial wealth has doubled since 2000 alone. The growth stems primarily from the bond markets. Between 2000 and 2013, the value of outstanding debt securities has almost tripled (from USD 33 trillion to USD 100 trillion). Over the same period, the total capitalization of stock markets has increased by a mere 35% (from USD 49 trillion to USD 66 trillion). The share of gold can also be seen. While it has grown considerably since 2000, it nevertheless remains at an extremely low level.

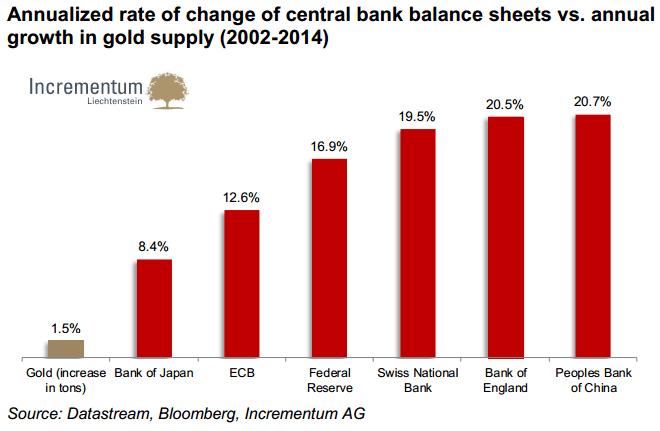
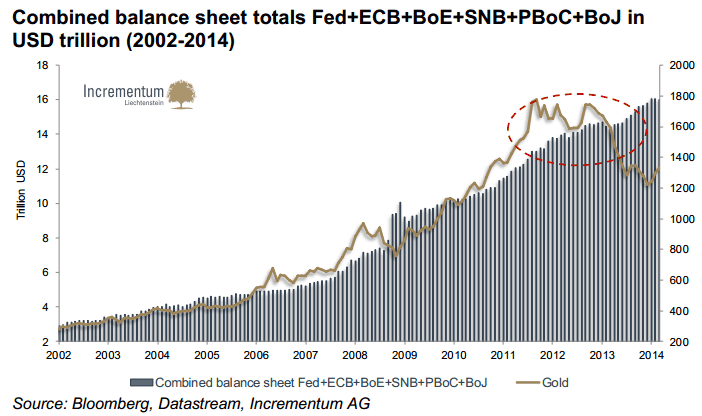
The following chart shows the divergence between money supply growth and the trend in the gold price that has been underway since 2011. It shows the combined balance sheet totals of Federal Reserve, ECB, Bank of England, People’s Bank of China and Bank of Japan. Whenever the money supply grows at a faster pace than the supply of physical gold, the gold price should rise and vice versa. The chart shows us that either the gold price has corrected too much, or that central bank balance sheets will stagnate, resp. decline, in the future. Anyone familiar with economic history knows how few precedents of sustained reductions in central bank balance sheets exist.

What is already clearly recognizable is that these massive market interventions marked a regime change: while before 2008, a balance between economic growth and moderate price inflation were the focus of central bank efforts, central bankers have in the meantime mutated into slaves of the financial markets. The continual artifices of banking and currency policy appear to have now become a necessity, so as to prolong the continued existence of the fiat debt money system.
Japan’s Abenomics program is in Ronald Stoeferle’s view emblematic for the “Keynesian endgame” currently underway. It is a final desperate attempt to keep a debt dynamic going that must sooner or later collapse. We also see Japan as a harbinger of what the West will soon face as well. A painless way out of this situation is by now unthinkable.
“As we look back throughout history, it quickly becomes obvious that Christopher Columbus was the world’s first modern central banker. He left without knowing where he was going, when he arrived he did not know where he was, and he did it all with other people’s money.” Charles Gave
From an economic point of view, the current “lowflation” environment that still prevails, which is characterized by low price inflation and growth figures that largely remain below expectations, has turned out to be a Land of Cockaigne for stock market investors. As long as stimulus does not show up in inflation data, market participants don’t fear a drying up of the monetary aphrodisiac. Among investors, the prevailing sentiment is “the crisis was yesterday”, and the “Yellen Put” is considered an integral feature of asset allocation decisions in many portfolios. The longer the low interest rate environment continues, the more investors will be pushed toward excessive risk tolerance.
The monetary experiments currently underway resemble a walk on a knife’s edge. A low rate of inflation can be driven up by brute force through decisive central bank action. Whether the flood of liquidity that is currently put at the banking system’s disposal can really be removed in time is more than questionable. In a worst-case scenario, a loss of confidence in the currency may occur that can no longer be reversed. It was said in the 1920s that central bankers were like ships captains who not only refused to learn the basic rules of navigation, but even asserted that they were superfluous. At the moment the impression is that central bankers are attempting to cross the Pacific using a map of the Atlantic.
Stoeferle writes it cannot be stated a priori whether inflationary forces will prevail in this power struggle. However, due to existing socio- economic incentive structures, when in doubt, higher price inflation will definitely be preferred over a deflationary adjustment. However, disinflationary forces should not be underestimated. The southern European banking system has not yet been sufficiently recapitalized in the wake of the credit bust and is very reluctant to extend new loans. The preceding credit boom has left a palpable deflationary echo behind.
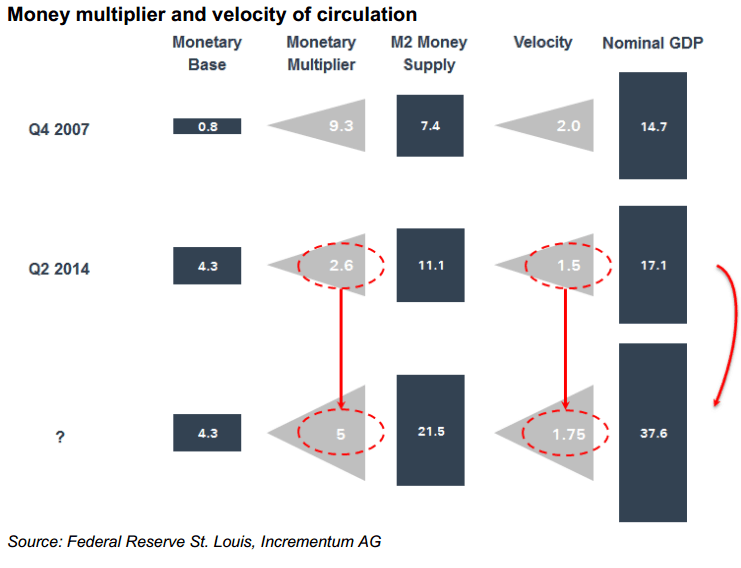
In order to get an idea of the potential inflation in the system, the following illustration shows how large the potential for inflation is which has been “stored up” due to the generous supply of central bank liquidity. To this end we employ the above described logic of the monetarist perspective and assume that the money multiplier and the velocity of circulation normalize.

It cannot be ruled out that deflationary effects will intermittently prevail, e.g. due to another banking crisis or a government bankruptcy. A temporary deflationary episode similar to that of 2008, on the road to greater inflation, could well be a realistic scenario. More about the inflation vs deflation war was discussed in great detail in the monetary tectonics chartbook released earlier this year.
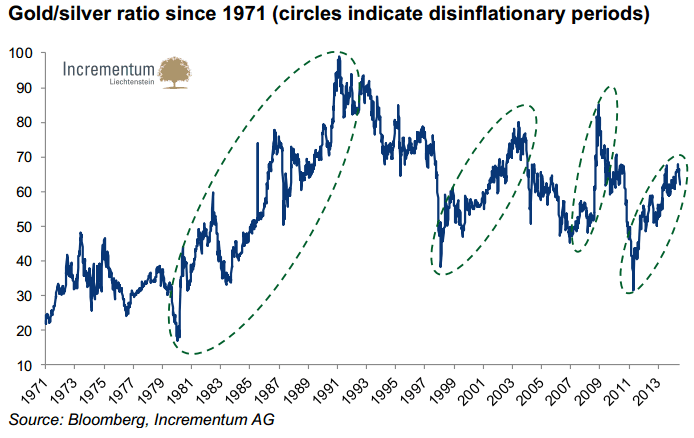
Since the autumn of 2011, when inflation rates in the US stood at an annual rate of change of more than 4%, we have seen a strong disinflation trend. Since the inflation rate has in the meantime fallen significantly below the official 2-2.5% target, and the trend continues to point down, the Federal Reserve and the ECB have leeway to take countermeasures against the disinflation trend. Should the trend of price inflation reverse, excellent opportunities in inflation-proof investments would present themselves.
The gold/silver ratio appears to be useful measure to monitor the disinflation in the system, as evidenced by the following chart.

As far as gold is concerned, the report concludes with an analogy of central bankers’ behavior to that of a pharmaceutical company that forces the market to take a medication that has never before been clinically tested. Investors should not only focus on the near-term successes of the treatment, but also consider the long-term side effects. The current state of the monetary system and expected continuation of monetary policies by central planners around the world make up for the fundamental case of a gold investment.
The In Gold We Trust 2013 report was published on 27 June 2013, just as the anxiety over the metal’s declining price trend reached its peak. In hindsight, this date turned out to coincide with a multi-year low. Last year, Ronald Stoeferle came to the conclusion that massive technical damage had been inflicted and that it would take some time to repair the technical picture. That forecast has turned out to be correct, even though the counter-trend move turned out to be significantly weaker than expected. Recent months show clearly that many speculators have given up on the sector. A majority of bulls appear to have thrown in the towel. Volatility and market participant interest have decreased significantly in the last year.
From a technical perspective our assumption is that the gold price is near the end of its long consolidation period. The clearly positive CoT data, negative sentiment and not least the recently evident relative strength in gold mining shares all suggest as much. The ongoing consolidation since the all-time high in the late summer of 2011 is important for the bull market’s health. The nominal gold price may well appear to be still high, but relative to the monetary base it is actually at an all- time low. In our opinion this is a temporary anomaly which we regard as an excellent entry opportunity. The report shows that gold remains attractively priced relative to stocks and bonds, but also relative to a number of hard assets. Hence, the gold bubble argument often forwarded by pessimists is refuted as well, making the gold investment case even more compelling.
In terms of valuation of the gold price based on the monetary valuation model, the degree of gold’s monetization relative to the monetary base currently stands at 8%, which represents an all-time low. Confidence in US monetary policy is therefore very high. Very few market participants regard price inflation as an imminent danger.
Similarly, valuation of the gold price relative to other asset classes paints a very positive picture. Both in relation to monetary aggregates, as well as to traditional asset classes (stocks and bonds), gold is below the long-term averages. Compared to a selection of “real assets” a number of ratios are above the mean, but remain far from extreme values.
Stoeferle is convinced that gold stocks’ risk-reward profile is highly asymmetric, i.e., the downside seems limited relative to the potential upside. Creative destruction in the sector is normal and healthy for the long-term. In the course of the market adjustment, mining companies are resetting their priorities: profitability, capital discipline and shareholder value have replaced maximization of production. Moreover, there is currently no other sector that meets with more skepticism from investors.
In terms of gold price expectations, it appears that the repair of technical picture is now behind us and that a stable bottom has formed. The next 12 month price target is the USD 1,500 level. Longer term, the author expects a parabolic trend acceleration, with a long-term target of USD 2,300 by the end of the cycle.
Furthermore, the report does an outstanding job in covering the following topics
- 1971: The monetary paradigm change
- Systemic inflation addiction
- The gold price and scenario analysis
- The consequences of global zero interest rate policy
- Gold and the international financial order
- Quantitative valuation models for the gold price
- Stock to Flow as the most important reason for gold’s monetary importance
Incrementum Liechtenstein AG | Email: contact@incrementum.li
Source - http://goldsilverworlds.com/economy/the-coming-crash-of-the-financial-and-monetary-system/
© 2014 Copyright goldsilverworlds - All Rights Reserved Disclaimer: The above is a matter of opinion provided for general information purposes only and is not intended as investment advice. Information and analysis above are derived from sources and utilising methods believed to be reliable, but we cannot accept responsibility for any losses you may incur as a result of this analysis. Individuals should consult with their personal financial advisors.
© 2005-2022 http://www.MarketOracle.co.uk - The Market Oracle is a FREE Daily Financial Markets Analysis & Forecasting online publication.


