


Reflections on the Global Misery Index
Economics / Social Issues Jul 22, 2014 - 10:23 AM GMTBy: Steve_H_Hanke

 Recently, I calculated misery index scores for 89 countries (see: Globe Asia May 2014). For any country, a misery index score is simply the sum of the unemployment, inflation and bank lending rates, minus the percentage change in real GDP per capita. A higher misery index score reflects higher levels of “misery”.
The calculations I presented earlier represent a snapshot of the state of misery by country for 2013. In what follows, I present scores calculated over time for several regions and a few selected countries in Asia. These allow us to reflect on the scores in terms of their topological patterns.
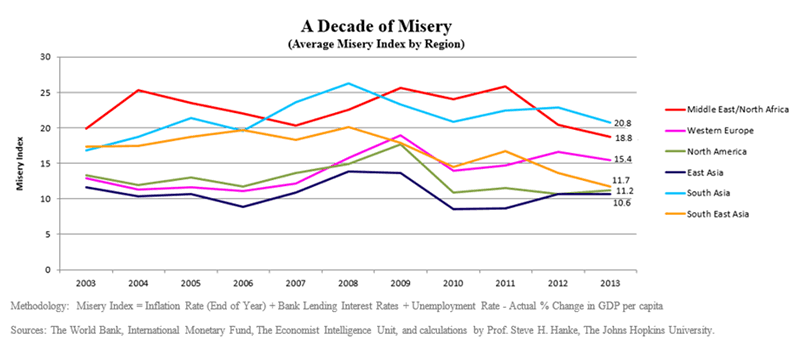
The first chart shows the misery index patterns by major regions over the past decade. Several things are worth noting. Even on an aggregate basis, the chart features two poles of attraction: one centered at a score of twenty and another at ten. Countries that gravitate towards the higher pole generally need a heavy dose of structural (read: free-market) reforms. Conversely, countries closer to the lower pole have considerably more economic freedom.
Since the financial crisis of 2008-09, Southeast Asia’s level of misery declined from a score of roughly 20 to 11.7, which suggests that there has been positive structural reform in the region. I should also add that quantitative easing by the U.S. Federal Reserve generated significant hot-money flows that positively affected South East Asia.
Western Europe’s endemic structural problems also show up in the chart. Since the crisis, the region’s misery score remained elevated because of pronounced problems in labor markets. To bring the score from its current 15.4 reading down to 10, Europe needs some significant economic liberalization.
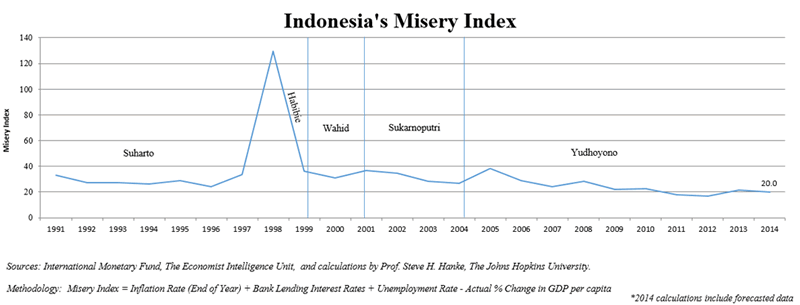
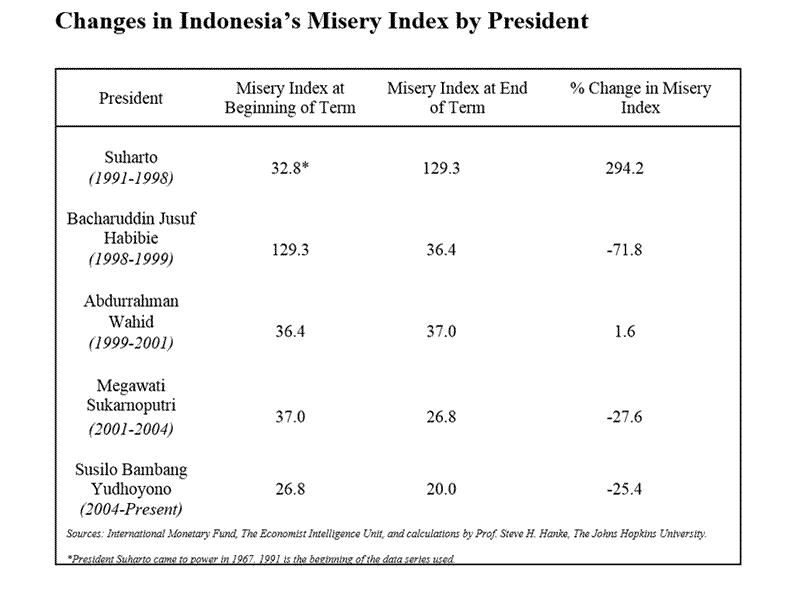
Let’s now move from regional groupings to individual countries. Indonesia displays an interesting picture. Thanks to the disastrous advice of the International Monetary Fund (IMF), Indonesia floated the rupiah on 14 August 1997. Contrary to the IMF’s expectations, the rupiah did not float on a sea of tranquility. Its value plunged from 2,700 rupiahs per U.S. dollar, at the time of the float, to lows of nearly 16,000 rupiahs per U.S. dollar in 1998. In consequence, Indonesia’s inflation and its misery index score soared, and Suharto was brought down after 31 years in power. Then, the score fell sharply, and since the Wahid government, it has been drifting downward. Changes in Indonesia’s misery index score and its components are displayed in the accompanying table.
At present, Indonesia’s score of 20.0 is right on the magnetic twenty pole. Whoever is eventually crowned winner of the recent presidential election must introduce serious structural reforms if he wishes to see Indonesia’s misery index score fall towards the lower magnetic pole.
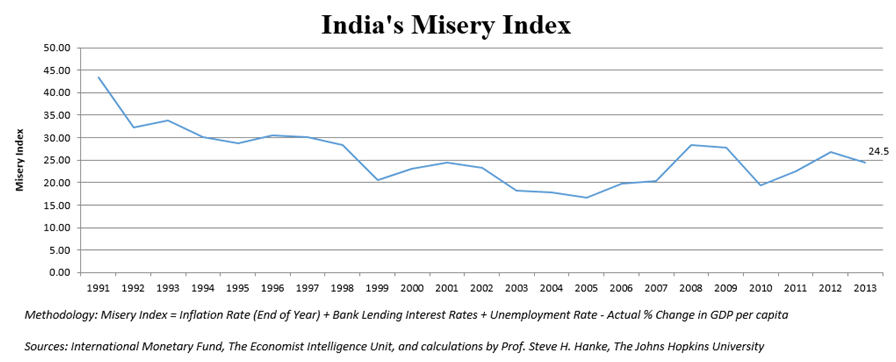
Narendra Modi, the newly elected prime minister of India, faces a misery index score of 24.5. Given the nature of India’s political system and bureaucracy, he certainly has his work cut out for him. Modi will have to go beyond voicing his plans for reforms to ensure their implementation and a significant reduction in India’s misery index score.
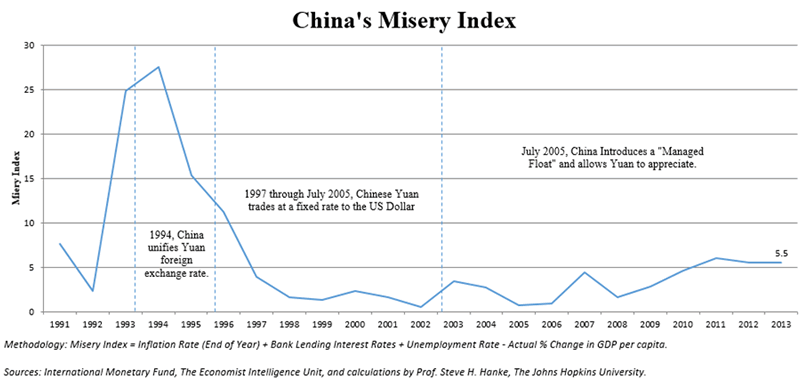
While still in Asia, we must take a look at two stellar performers, China and Singapore: both have scores below ten. China is noteworthy because its misery index score was well below five during the 1997 – 2005 period. It was then that the yuan was tightly linked to the U.S. dollar. China’s misery index score began to steadily climb only after the country allowed the yuan to appreciate against the greenback due to pressure from Washington, D.C..
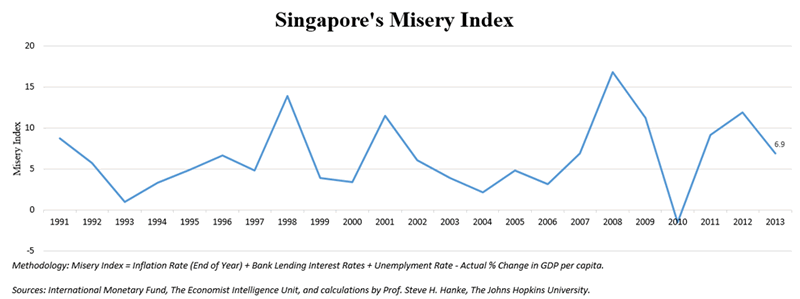
By most measures of competitiveness, Singapore holds one of the top spots. It’s not surprising, therefore, that Singapore’s misery index scores are low and even dipped into negative territory in 2010.
A topological trip down the misery index lane reveals two centers of gravity: twenty and ten. The countries whose scores hover around ten are simply reaping free-market dividends. Those with scores around twenty are rather miserable and serious candidates for deep free-market reforms. Without these reforms, those countries are destined to stay, well, miserable.By Steve H. Hanke
www.cato.org/people/hanke.html
Twitter: @Steve_Hanke
Steve H. Hanke is a Professor of Applied Economics and Co-Director of the Institute for Applied Economics, Global Health, and the Study of Business Enterprise at The Johns Hopkins University in Baltimore. Prof. Hanke is also a Senior Fellow at the Cato Institute in Washington, D.C.; a Distinguished Professor at the Universitas Pelita Harapan in Jakarta, Indonesia; a Senior Advisor at the Renmin University of China’s International Monetary Research Institute in Beijing; a Special Counselor to the Center for Financial Stability in New York; a member of the National Bank of Kuwait’s International Advisory Board (chaired by Sir John Major); a member of the Financial Advisory Council of the United Arab Emirates; and a contributing editor at Globe Asia Magazine.
Copyright © 2014 Steve H. Hanke - All Rights Reserved
Disclaimer: The above is a matter of opinion provided for general information purposes only and is not intended as investment advice. Information and analysis above are derived from sources and utilising methods believed to be reliable, but we cannot accept responsibility for any losses you may incur as a result of this analysis. Individuals should consult with their personal financial advisors.
Steve H. Hanke Archive |
© 2005-2022 http://www.MarketOracle.co.uk - The Market Oracle is a FREE Daily Financial Markets Analysis & Forecasting online publication.