


USDJPY Big Bear Market
Currencies / Forex Trading Jul 31, 2014 - 07:34 PM GMTBy: Austin_Galt

 The USDJPY has jumped higher recently so I decided to investigate and the findings are quite interesting. An opportunity may well be approaching. Let's take a look at the charts to find out more about it.
First, let's begin by looking at the big picture. The yearly chart no less.
Yearly Chart
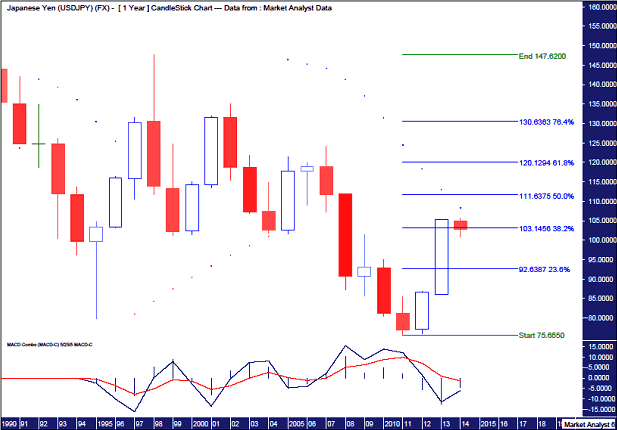
What is clearly evident here is a pattern of lower lows and lower highs - a bear market. Price made a low of 75.65 in 2011 and since then rallied sharply into a 2014 top at 105.73 before retreating a little to where it is now just below 103.
I have added Fibonacci retracement levels of the down leg from the 1998 high to the 2011 low. So far, price has retraced to just above the 38.2% level. That could be it. If so it would indicate that the downtrend is in a reasonably strong position. Can price rally further? Sure. But there are a couple of indicators to suggest otherwise.
First, I have added a Parabolic Stop and Reverse (PSAR) indicator which is denoted by the dots on the chart. The PSAR can be quite useful when price is clearly trending. Currently, the dots are to the upside and act as resistance. There looks to be slightly more room to the upside without taking the dots out. However, looking further out, until those dots are busted then bias has to be given to the downside.
Also, the Moving Average Convergence Divergence (MACD) indicator suggests that more downside is probable with the red line above the blue line.
The 2014 top may well turn out to be the next swing high implying a move to new lows below the 2011 low which is in line with the bear trend.
Let's move on to the monthly chart.
Monthly Chart
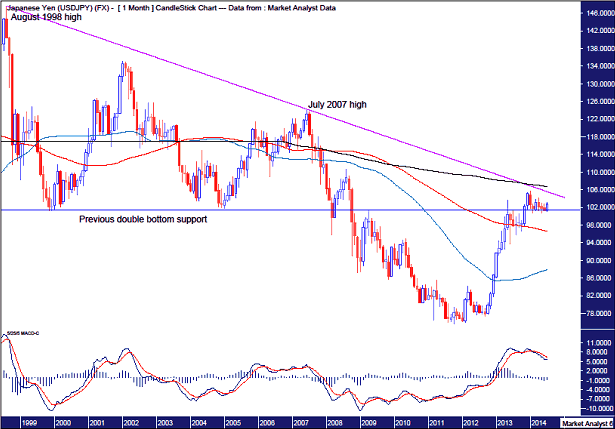
I have drawn a down trend line across the tops of August 1998 and July 2007. We can see that price is currently just below this trend line which looks to be providing resistance. Until that trend line is broken, bias has to be to the downside.
I have drawn a horizontal line which denotes the previous double bottom support. This was broken back in 2008 and is a bearish sign. Broken support often acts as resistance in future and this appears to be the case here. Price is just tickling the upside of this line with no clear breakout above this resistance level. Hmmm.
I have added three moving averages. The black line (200ma) is above the red line (100ma) which in turn is above the blue line (50ma). That means conditions are perfect for a downtrend. Also, the rally since the 2011 low looks to have found resistance at the 200ma. And this is the monthly chart so some fairly solid evidence right there.
Finally, the MACD shows the red line above the blue line suggesting lower prices are likely going forward.
While all this evidence is negative, there is still room for price to go higher, even making a marginal new rally high without turning these indicators overly positive. Now I doubt a new marginal high will be seen but I can't completely rule it out.
I now want to skip to the daily chart as that is where things are about to get interesting.
Daily Chart
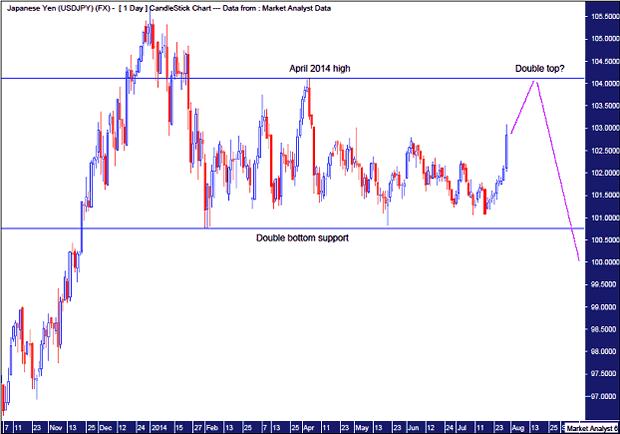
In my report on the USDJPY towards the end of May 2014, I pointed out the double bottom that had just formed. I thought this would be the springboard to a final marginal new high. If that were to be the case then price should have moved strongly upwards. On the contrary, price action since then has been weak. Wishy washy.
When price doesn't do as expected it's time to reanalyse and try and get back in-synch with the instrument. After reacquainting myself of the chart after the nice price rise in recent days I'm starting to feel the rhythm again.
Price looks headed up to the upper horizontal line which is the level of the April 2014 high. If price finds resistance at this level then we could very well have a double top in play. And as this top is below the previous top, it could be considered a double top with the trend if and when the double bottom support is busted. These types of double tops are lethal, for the bulls anyway. With a double top in place, the busting of double bottom support would most likely lead to a big whoosh south.
Obviously a clean break above the April 2014 would nullify this analysis. But until that happens, my confidence in the bearish double top scenario is building.
Bio
I have studied charts for over 20 years and currently am a private trader. Several years ago I worked as a licensed advisor with a well known Australian stock broker. While there was an abundance of fundamental analysts there seemed to be a dearth of technical analysts, at least ones that had a reasonable idea of things. So my aim here is to provide my view of technical analysis that is both intriguing and misunderstood by many. I like to refer to it as the black magic of stock market analysis.
Please register your interest in my website coming soon. Any questions or suggestions, please contact austingalt@hotmail.com
© 2014 Copyright Austin Galt - All Rights Reserved
Disclaimer: The above is a matter of opinion provided for general information purposes only and is not intended as investment advice. Information and analysis above are derived from sources and utilising methods believed to be reliable, but we cannot accept responsibility for any losses you may incur as a result of this analysis. Individuals should consult with their personal financial advisors.
© 2005-2022 http://www.MarketOracle.co.uk - The Market Oracle is a FREE Daily Financial Markets Analysis & Forecasting online publication.