


ASX200 Stock Market Index Set For New Highs
Stock-Markets / Stock Markets 2014 Sep 21, 2014 - 01:07 PM GMTBy: Austin_Galt

 This market has been tracking as expected over the last couple of months. However, price has now come down to the "moment of truth" zone. Will a downtrend be confirmed or will the uptrend continue? Let's find out starting with the daily chart.
Daily Chart
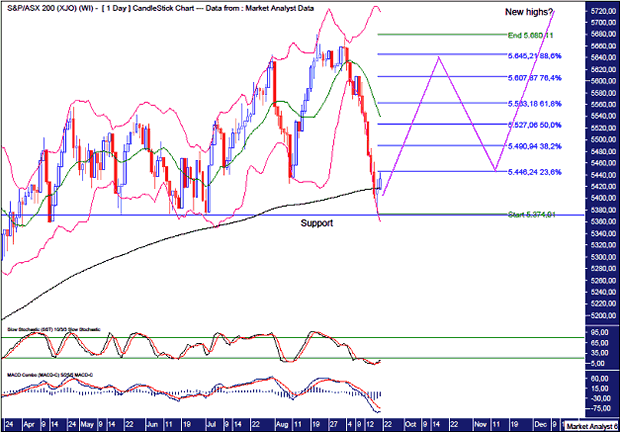
We can see a second marginal high in place which led to a significant move down. Price even broken its previous swing low set in August. However, price has now come down to major support which is denoted by the horizontal line. We can see this support has repelled several previous attempts to break down. Breaking down here will most likely confirm a downtrend in play. Will this happen?
We can see last Thursday's candle hit smack bang on this support level before reversing and making a positive reversal candle. Then Friday showed follow through to the upside. This is bullish. A downside test and heading back up would like nice for the bulls.
The Bollinger Bands show price clinging to the lower band during this move down and only just now threatening to move away.
The Stochastic indicator shows a recent bullish crossover while the Moving Average Convergence Divergence (MACD) indicator looks to be threatening one.
Also, I have added a 200 period moving average denoted by the black line. This is another major potential support zone and price is trading right around this level now.
I have added Fibonacci retracement levels of the move down. Personally, I am leaning to the bullish camp but even if a downtrend is to occur perhaps price can make a deep retracement before doing so. I favour price rallying up to around the 88.6% level at 5645. If this is a big consolidation playing out then a move up to test the highs would certainly not look out of place.
Then another move down can take place which could then bust through the support level. Alternatively, I favour price finding support once again and rallying into new highs in November and December as part of a Christmas rally.
Let's move on to the weekly chart.
Weekly Chart
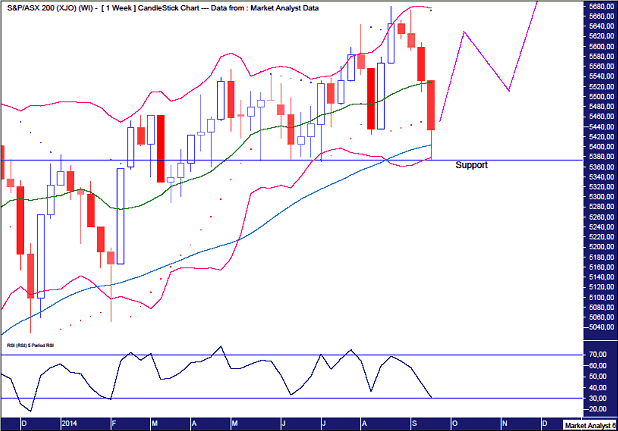
I have added Bollinger Bands which show price coming down and bouncing right off the lower band. Interestingly, the lower band was right around the support level denoted by the horizontal line. Follow through to the downside here would not look good.
The Relative Strength Indicator (RSI) is verging on oversold conditions. A move back up would not surprise here.
I have also added a Parabolic Stop and Reverse (PSAR) indicator which pertains to the dots. This is now negative with the dots to the upside. I expect these dots to contain the next rally higher, if there is one of course, but then to succumb during the Christmas rally. I hope I'm not being too presumptive here!
Monthly Chart
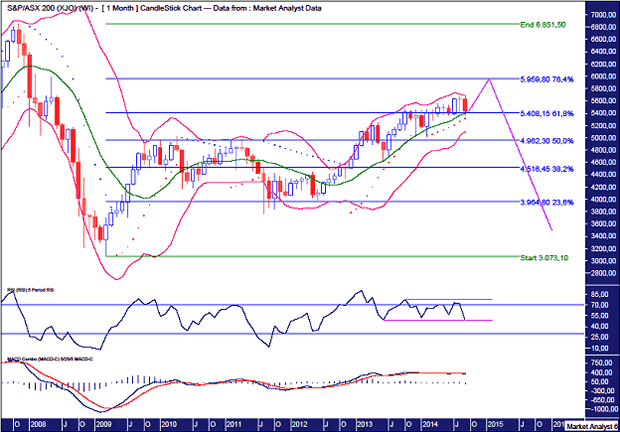
The Bollinger Bands show price trading within the upper and middle bands for the last couple of years. Price is now back to the middle band. Will this provide support once again? The daily and weekly analysis suggests so.
The RSI looks as if it may be forming a sideways channel with price now at the bottom of the channel. Price finding support here and trading back up would likely this this sideways channel hold true.
The MACD has been tracking sideways for over a year now. There was a recent bearish crossover but perhaps that is just part of the pattern of toing and froing it has been exhibiting. Follow through to the downside in October would see this bearish crossover confirmed. Personally, I doubt that scenario.
The PSAR is still bullish with the dots to the downside. The dots are currently at 5321 and breaking those dots now would be bearish. I doubt it. Instead, I feel the PSAR will provide support and the springboard for higher prices.
I have added Fibonacci retracement levels of the move down from all time high to the 2009 low. Price has already taken out the 61.8% level with the next level being the 76.4% level at 5959. Perhaps that is where price is headed for final rally top. Let's see.
Let's now wrap it all up by looking at the big picture - the yearly chart.
Yearly Chart
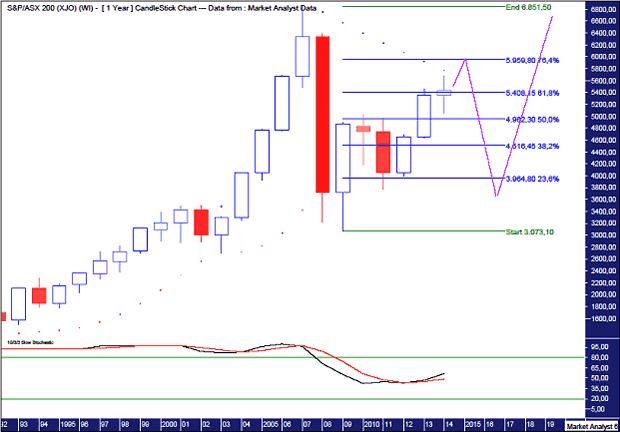
This year looks to have seen off the bearish challenge and we may well end up with a positive candle. That would likely lead to further new highs in 2015 even if only marginally.
The Stochastic indicator is trending up so that augurs for higher prices. It doesn't exactly look to be in solid standing and a move down shortly would not surprise.
I have added the PSAR which still has a bearish bias with the dots above. However, considering the analysis already undertaken, I believe price can now trade up and bust those dots to the upside. Those dots currently stand at 5783. That would then mean the dots provide support on the downside and price could then move down to test that support.
I have added the Fibonacci levels from the monthly chart and a move up to the 76.4% level would fit in nicely being just above the dots of the yearly PSAR.
As for nailing down the numbers, a 1% move lower would most likely confirm the downtrend while a move to the 76.4% level at 5959 is around 10% higher. That's around a 10/1 shot in punting parlance. That type of risk reward play may see me give the long side a bit of a tickle next week.
In concluding, price is now at a critical juncture. Does price confirm a downtrend or continue with the uptrend? I favour the latter.
By Austin Galt
Austin Galt is The Voodoo Analyst. I have studied charts for over 20 years and am currently a private trader. Several years ago I worked as a licensed advisor with a well known Australian stock broker. While there was an abundance of fundamental analysts, there seemed to be a dearth of technical analysts. My aim here is to provide my view of technical analysis that is both intriguing and misunderstood by many. I like to refer to it as the black magic of stock market analysis.
© 2014 Copyright The Voodoo Analyst - All Rights Reserved
Disclaimer: The above is a matter of opinion provided for general information purposes only and is not intended as investment advice. Information and analysis above are derived from sources and utilising methods believed to be reliable, but we cannot accept responsibility for any losses you may incur as a result of this analysis. Individuals should consult with their personal financial advisors.
© 2005-2022 http://www.MarketOracle.co.uk - The Market Oracle is a FREE Daily Financial Markets Analysis & Forecasting online publication.