


Stock Markets, Commodities and Indicators
Stock-Markets / Financial Markets 2014 Oct 17, 2014 - 03:41 PM GMTBy: Gary_Tanashian

 Allow me to share a simple sketch I drew that was part of an NFTRH interim update for subscribers last night. The black line is where we have been. The blue line is a projection of what a typical correction (whether a healthy interim one or a bear market kick off) might look like.
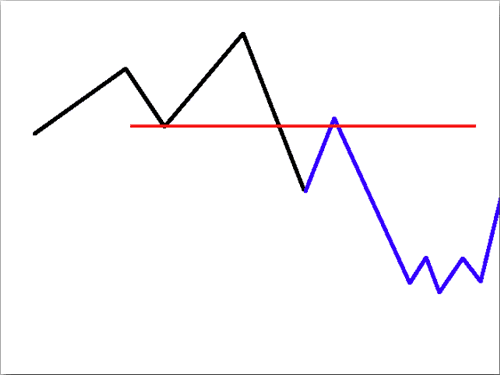
We used real charts of the Dow, S&P 500 and Nasdaq 100 to gauge the entry into the current correction and now the resistance points to the expected bounce off of the US market's first healthy sentiment reset in quite some time. But our cartoon above gives you the favored plan on how the correction could play out.
Yesterday, the market bounced on what can only be viewed as a sad attempt by a Fed member (a perceived Hawk, no less) to jawbone a stop to the impulsive bearishness. The strength of the US dollar and first decent correction since 2011 seems to have spooked the folks over at Policy Central and suddenly they are talking QE again. That does not inspire confidence, if you are a bull. Be that as it may, we have been due for a bounce to clean out the over bearish and over sold conditions.
Moving along, we are making no claims to know whether or not this is a bear market kickoff because when the process is complete per the sketch above a trade-worthy rally should materialize when a notable low is ground out. An impulsive straight line drop, to support though it is in many cases (ref. the real charts of the Semiconductors and the Banks), and recovery on policy makers' jawboning is not usually a path to sustained recovery.
NFTRH is managing a bounce (the first 'up' phase of the blue line above) until/unless it proves it is more than that. Traders should be nimble. If the projection proves out, a renewed decline into November could follow, which should come out of a good setup for bearishly inclined traders.
Moving on, let's not use a single real chart and just give a brief update of each of the usual markets we cover in NFTRH...
US Stock Market
Volatility is back and while it seemed to come out of nowhere, it was easily readable in advance by steadily declining junk vs. quality bond yields spreads, declining index and sector participation rates and of course, the strong US dollar (which is decidedly not on the favored agenda of asset-friendly policy makers), among several other indicators we tracked into and through the first part of the correction.
Per the scenario above, in the likely event a bottom has not yet been registered, one will eventually be ground out and it should be good for a trade at least. Personally, I have positioned for a bounce right here but that is not recommended for anyone who is not willing to trade on a dime, in-day and in-week. The answer to the question 'cyclical bull ender or not?' does not need to come yet, but there is going to be data galore going forward. We'll work the data as it comes in. Meanwhile, an intermediate bear trend is in force.
Global Stock Markets
We had gauged the out performance of the Emerging Markets (EEM vs. SPY) for much of this year, but when the ratio broke down we noted it in real time, we (i.e. an NFTRH+ trade idea) shorted the EM's and prepared for coming bearishness in US markets. We have been charting Europe's decline for months now, initially shorting Spain, which had previously been our guide to the upside speculative impulse that took hold in Europe.
Global markets are nearly but not yet broken with Europe and the World index at key big picture support, the Emerging Markets having made a false breakout and failure, China actually looking interesting here, Japan playing the 'push me, pull you' game with its currency and Canada doing some bearish things as the TSX not only loses its blue sky breakout, but starts snapping support levels. The TSX-V (CDNX) is leading the way down and is flat out destroyed right along with any speculative spirits in the world of scammy little Canadian 'resource' plays.
Commodities
Early in 2014 we charted the CCI index's hold of critical support at 500 and the resistance to the breakout and rally that followed. More recently we managed the decline to and through that support level while maintaining a "not interested" stance the whole way. Commodities can bounce with any 'inflation trade' bounce (watch TIP-TLT and other inflation expectations indicators) that may manifest.
Indicators
We were not interested in commodities because we were given no reason to have a favorable view of inflation expectations, which through the TIP-TLT ratio were gauged to be burrowing through the floor week after week. This was also another negative for the US stock market, which had been feasting like Goldilocks, on the bears' porridge.
Foremost among the indicators have been Yield Curves generally favoring US stocks and hurting gold, until the curve burst upward beginning last week. This has not surprisingly come with the US stock market correction. If the market bounces, the curve can decline and junk-quality bond spreads can bounce. Also, the VIX needs a rest.
The big daddy of indicators however, has been the 2 Horsemen, i.e. the Gold-Silver ratio and the USD, rising together. This was an indicator of failing liquidity which NFTRH and indeed this public website, noted in real time.
It is the indicators even more so than straight up TA that will help us decide whether or not the bull market has ended as we move forward through coming data points.
Economy/Currencies
Deflationary and economic growth troubles across the globe are blamed for the recent strength in the US dollar and to a degree that holds merit. The other support has been the very real economic recovery in the US (beginning with the Semiconductor sector, which NFTRH 312 looked into in depth last weekend) born of very unreal (i.e. unnatural and unsustainable) policy inputs (ref. the chart in this post showing the S&P 500 tended all the way by supportive policy).
Naturally, it stands to reason that if dollar compromising policy is promoted to keep assets aloft, then a strong dollar is unwelcome because not only would it begin to eat away at exporting sectors like manufacturing, but it would also make assets less expensive. But that should be a good thing, no? Declining prices in things like oil, food and services? Not on the one-way street that is our current system of Inflation on Demand.
The Yen is strong lately and the Euro can gain a bounce bid. This means that the USD can continue to weaken from its impulsively over bought and over loved levels. But on the big picture USD has been moving upward from a long-term basing pattern (see US Dollar is Extreme).
Precious Metals
Gold is favored over silver, given the move in the Gold-Silver ratio and diminishing global liquidity. Beyond that, gold's fundamentals have not been constructive for some time now, no matter how often idealists click the heels of their ruby slippers.
That was then, this is now. Gold is counter cyclical per the Gold-Commodities chart in this post. This one chart is the very reason that NFTRH never did take its focus off the biggest picture view of an ongoing global economic contraction in progress. This would be the gateway to a real bull market in gold stocks, but it is also the more difficult pathway because the inflationists get weeded out along the way as silver does not go to the moon and lazy analysis gets punished, not rewarded.
Gold stocks are counter cyclical and macro indicators say we may be at the start of grinding out a counter cyclical phase. But note the word grind. That's what it has been and what it could continue to be for a while yet. As gold slowly asserts itself vs. cyclical commodities cost-input fundamentals gradually improve in the industry and as gold slowly asserts itself vs. stock markets an important component of investor psychology slowly comes into place.
Patience... the macro does not pivot over night.
Subscribe to NFTRH Premium for your 25-35 page weekly report, interim updates (including Key ETF charts) and NFTRH+ chart/trade ideas!
By Gary Tanashian
© 2014 Copyright Gary Tanashian - All Rights Reserved
Disclaimer: The above is a matter of opinion provided for general information purposes only and is not intended as investment advice. Information and analysis above are derived from sources and utilising methods believed to be reliable, but we cannot accept responsibility for any losses you may incur as a result of this analysis. Individuals should consult with their personal financial advisors.
© 2005-2022 http://www.MarketOracle.co.uk - The Market Oracle is a FREE Daily Financial Markets Analysis & Forecasting online publication.