


Global Economic Slowdown in Stagflationary Environment
Economics / Stagflation May 25, 2008 - 11:43 AM GMT

 Asha Bangalore (Northern Trust): Leading indicators – premature to rule out recession
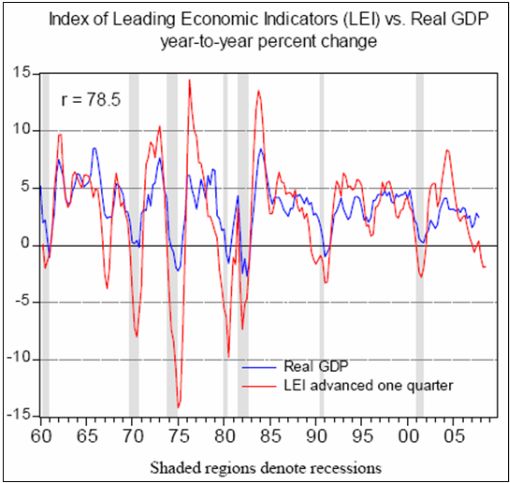
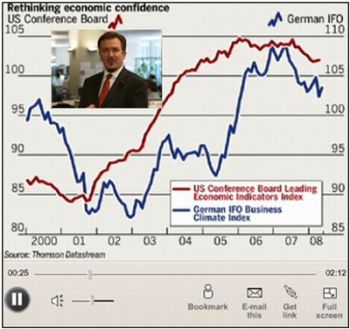
“The Index of Leading Economic Indicators (LEI) moved up 0.1% in April, matching the increase seen in March. The two consecutive monthly gains of the index follow five consecutive monthly declines. The spokesperson from the Conference Board indicated that the index is indicative of weak economic conditions but ruled out the possibility of a recession.
“From the chart, we know that strongly negative readings of the year-to-year change in the LEI are associated with recessions, with the exception of 1966-67. On a year-to-year basis, assuming the April reading is the second quarter reading for the LEI, it was down 1.86% from a year ago. On a quarterly basis, the year-to-year change in the LEI is negative in four out of the five quarters ended first quarter of 2008. We need information about May and June to confirm the reading for the second quarter. The drop in consumer expectations in May and current readings of jobless claims point to negative contributions of these two indexes. It is premature to rule out the occurrence of a recession based on these monthly readings.”
Source: Asha Bangalore, Northern Trust - Daily Global Commentary , May 19, 2008.
Asha Bangalore (Northern Trust): Chicago Fed National Activity Index signals recession
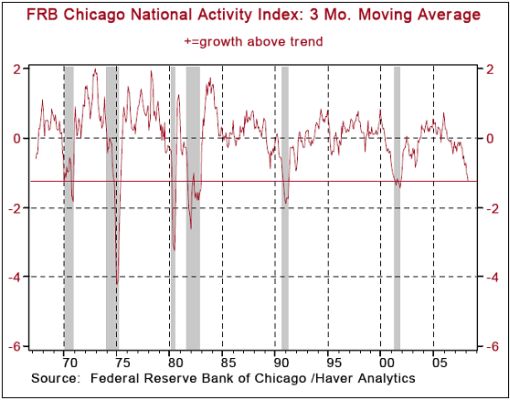
“The Chicago Fed National Activity Index (CFNAI) dropped to -1.17 in April from -0.98 in March (previously reported as -0.78). The CFNAI has posted negative readings every month since July 2006. Negative values of the CFNAI indicate below trend growth and positive values point to above trend growth.
“According to the Chicago Fed, ‘when the 3-month moving average of the CFNAI moves below -0.70 following a period of economic expansion, there is an increasing likelihood that a recession has begun.' The 3-month moving average of the CFNAI declined to -1.24 in April from -1.05 in March. April is the fifth month when the CFNAI has held below the -0.70 cut-off mark. Also, April's CFNAI is the lowest reading of the index since the months associated with the recession in 2001.”
Source: Asha Bangalore, Northern Trust - Daily Global Commentary , May 20, 2008.
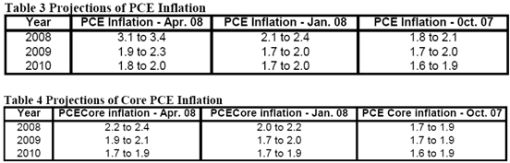
Asha Bangalore (Northern Trust): Fed's projections for GDP, inflation and unemployment
“The Fed published projections for GDP, inflation, and unemployment in 2008, 2009, 2010. These are forecasts of the members of Board of Governors and the presidents of the Federal Reserve Banks. Projections of unemployment rate, the growth of real GDP, of PCE inflation, and of core PCE inflation are central tendencies which exclude the three highest and the three lowest projections for each variable in each year.
“The central tendency of projections for real GDP for 2008, at 0.3% to 1.2%, is lower than the forecast presented in January. The economy is predicted to gain momentum in 2009 and grow at close to or above trend in 2010.
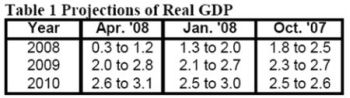
“Projections of the growth of real GDP are percent changes from the fourth quarter of the previous year to the fourth quarter of the year indicated.
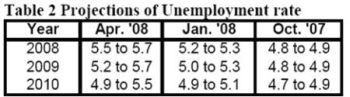
“Consistent with the below trend forecast of GDP growth in 2008, the unemployment rate is expected to move up (5.5% to 5.7%) in 2008. As the economy grows, the unemployment rate is projected to edge down in 2009 and 2010.
“The revisions of the inflation forecasts for 2008 reflect the steep increase in energy and food prices. The slightly higher predictions for core inflation imply a pass through of higher food and energy prices and the impact from higher import prices. Inflation was predicted to show some moderation by 2010.”
Source: Asha Bangalore, Northern Trust - Daily Global Commentary , May 21, 2008.
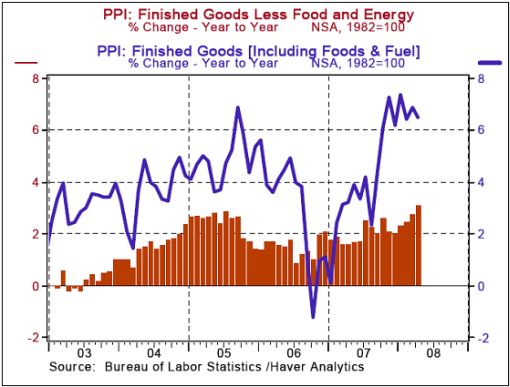
Asha Bangalore (Northern Trust): Wholesale prices present a troubling issue
“The Producer Price Index (PPI) for Finished Goods moved up 0.2% in April, following a 1.1% increase in the prior month. The steady reading for food and a 0.2% drop in the energy price index helped to tame the overall wholesale price index. On a year-to-year basis, the PPI for finished goods increased 6.5% in April versus a 6.2% increase in 2007. In the first four months of the year, the energy price index has risen at a seasonally adjusted annual rate of 18.0% and the food price measure has moved up 7.3% compared with a 17.8% gain in energy prices and a 7.6% increase in food prices in 2007.”
Source: Asha Bangalore, Northern Trust - Daily Global Commentary , May 20, 2008.
Bloomberg: Pimco's Gross says US underestimating inflation
“Pimco's Bill Gross said the US underestimates inflation through the methodology used to track consumer prices, making some emerging economies better real growth investment candidates.
“Changes in the way the Bureau of Labor Statistics measures prices over the past 25 years have led to the understating of inflation by at least 1%, Gross, said in a commentary on the company's web site today. The Federal Reserve's focus on ‘core' instead of ‘headline' inflation has also helped understate the increase in prices, Gross said.
“Pimco favors commodity-based assets and foreign equities that are denominated in currencies that demonstrate ‘authentic' real growth and inflation rates. Investors should shun US Treasuries and Treasury Inflation Protected Securities, or TIPS, because of their negative ‘unreal' yields as a result of ‘artificially low inflation,' he said.
“‘Investors might suddenly awake to the notion that US inflation should be and in fact is closer to worldwide levels than previously thought,' Gross said. ‘Foreign holders of trillions of dollars of US assets are increasingly becoming price makers not price takers, and in this case the price may not be right.'
“Emerging-market countries with economies similar to those of Brazil, Russia, India and China are ‘obvious' candidates for investment as inflation quickens, Gross said.
“Global headline inflation stands at 7%, Gross said. Prices rose 3.9% in the 12 months ended in April, down from a 4% year-over-year gain in March, the Labor Department said on May 14.”
Source: Lester Pimentel, Bloomberg , May 22, 2008.
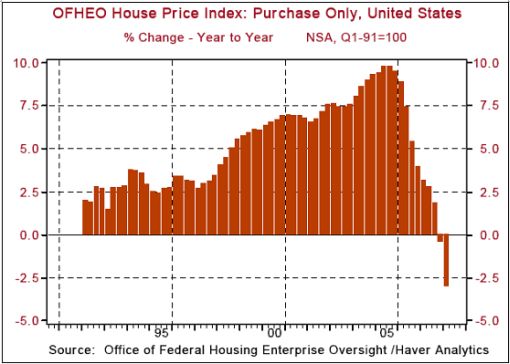
Asha Bangalore (Northern Trust): Downward descent of home prices likely to persist through 2008
“The OFHEO (Office of Federal Housing Enterprise Oversight) House Price Index declined 3.1% in the first quarter compared to a year ago. On a quarter-to-quarter basis, the OFHEO House Price Index fell 1.7%, marking the third consecutive quarterly drop of the index.
“The House Price Index is down 3.7% from the peak reading in April 2007. Incoming data from the housing market suggest that additional price declines should not be surprising, particularly given the large inventory of unsold homes.”
Source: Asha Bangalore, Northern Trust - Daily Global Commentary , May 22, 2008.
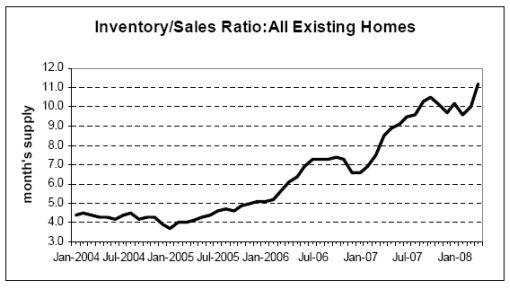
Asha Bangalore (Northern Trust): Existing home sales – Inventories remain a prickly problem
“Sales of all existing homes are down 32.4% from the peak level in August 2005. The decline in single-family home sales in the current cycle exceeds the pace seen in prior business cycles. The median decline in sales of existing single-family homes during the prior business cycles (1969 – 2001) was 24.8%. The April reading of existing single-family sales is down 31.6% from the peak in September 2005, which is slightly smaller than the 31.9% drop recorded for December 2007.
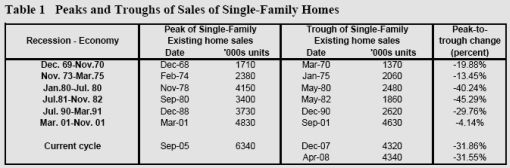
“The sales and price data of existing single-family homes suggest that there is a possibility of stability in this market in the near term. However, inventories of unsold homes remain a prickly problem. The inventory of unsold existing homes moved up to an 11.2-month supply mark in April, up from a 10-month supply in March. The stark inventory situation implies that additional price declines cannot be ruled out.”
Source: Asha Bangalore, Northern Trust - Daily Global Commentary , May 23, 2008.
Barry Ritholtz (The Big Picture): Housing Price to Rent Ratio
“All those Housing Bottom callers should consider the Housing Price to Rent ratio. It argues very loudly against a bottom anytime soon.”
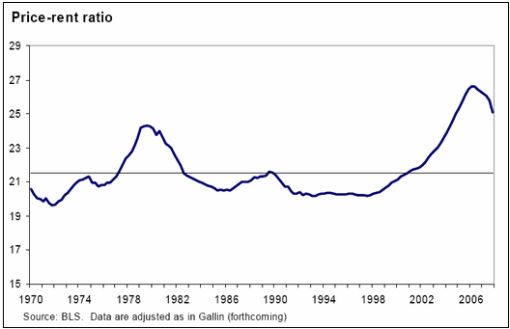
Chart courtesy of Janet Yellen, President, Federal Reserve Bank of San Francisco.
Source: Barry Ritholtz, The Big Picture , May 23, 2008.
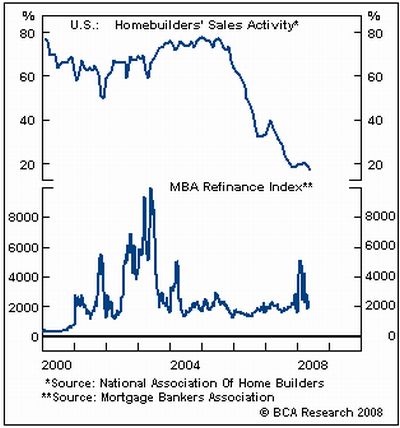
BCA Research: US home builders – No light at the end of the tunnel
“Sentiment among US home builders remains at rock bottom levels – builders expect no improvement in sales over the next six months.
“The fundamentals for housing remain weak, especially since the employment outlook has deteriorated this year and mortgage rates have not fallen in line with policy rates. The budding rebound in mortgage refinancing activity faltered the minute Treasury yields blipped up, underscoring that borrowing rates are too high to support the housing market. The spring selling season so far has been disappointing, implying that inventories will remain excessive.
“Bottom line: The housing market will stay depressed for the foreseeable future, acting as a limit on the upside in Treasury yields.”
Source: BCA Research , May 20, 2008.
John Authers (Financial Times): US house prices critical for financial markets
“Nothing now creates more uncertainty for markets, and nothing has greater import for the future, than the course of house prices in the US.
“US housing, of course, lit the fuse for the credit crisis. Among measures of housing, price is most important because of its link to the risk that owners abandon their homes, and thus to the risk to the value of the mortgage-backed securities that sparked the crisis. The best indicator of the coming rise in subprime delinquencies was the slowing in house price rises two years ago.
“House prices are also the greatest imponderable for those trying to model the future. There is no precedent for big falls, in nominal terms, in US house prices or for a situation where Americans' percentage of equity in their homes has dropped below 50%. Both have happened recently.
“It would appear, however, that if house prices fall and homeowners move into negative equity, the risk that homeowners will abandon their houses increases greatly. So moves in price to clear the housing backlog could have a greater impact than falls in construction (for which there are some precedents).
“It is extremely difficult to discern a long-term ‘fair value' for housing. Research by Robert Shiller of Yale University suggests that prices are 90% overvalued compared to their average ratio to rents over the past 80 years – but they are actually slightly undervalued compared to disposable incomes per capita.
“So far, prices have followed construction activity down. Permits for new housing ticked up in April, sparking hopes that an end was in sight. But futures on the S&P Case-Shiller house price index suggest prices could fall 13% over the next year, and 20% by the end of 2012. That shows the depth of the uncertainty. How it is resolved is critical for markets far beyond US housing.”
Source: John Authers, Financial Times , May 19, 2008.
Financial Times: Pimco's chief piles into mortgage debt
“Bill Gross, the manager of the world's biggest bond fund, has switched gears to make a big bet on mortgage debt, almost tripling his holding of it to more than 60% of the fund.
“Mr Gross's $130 billion Pimco Total Return fund pulled sharply ahead of rivals in the past year after the manager predicted a housing downturn and sold out of housing-related securities and corporate bonds.
“The fund has returned 12.6% over 12 months, beating 99% of its peers, according to fund tracker Morningstar.
“Mr Gross said his decision to raise exposure to mortgage debt in recent months was based on the US government's implicit guarantee of Freddie Mac and Fannie Mae, the government-sponsored mortgage agencies.
“Mr Gross said Pimco was buying primarily mortgage agency debt and ‘not the subprime garbage'.
“The Total Return fund is now invested about 61% in mortgage debt, compared with just over 20% a year ago.
“Mr Gross was heavily overweight US Treasury bonds in the early 2000s but is now scornful of them and the fund is using derivatives to gain from any downturn in Treasuries. He called Treasuries ‘the most overvalued asset'.
“‘If there was a bubble, the popping has produced a counter-bubble in quality securities. The safe haven has been way overdone. Treasuries are yielding 2% to 3%, there is no real return on that at all,' he said. ‘This is an asset class that is held by sovereign wealth funds and central banks … but that is not any reason to follow them.'”
Source: Deborah Brewster, Financial Times , May 22, 2008.
John Authers (Financial Times): Misplaced equity optimism
“… the success of equities at the moment comes from … extreme optimism on corporate earnings. This is hard to square with the still lukewarm outlook for the economy, or with the historically high profit margins with which the corporate sector entered the slowdown.”
Source: John Authers, Financial Times , May 21, 2008.
David Fuller (Fullermoney): Surge in oil prices bearish for stock markets
“Rising oil prices are usually a headwind for most stock markets, although less so when the advance is gradual. However crude oil has risen more rapidly recently and today's move represents trend acceleration. We know from past experience that such moves are unsustainable beyond the short term. They are climactic and therefore followed by sharp reactions. However there is still no evidence that oil has peaked.
“As the world's most important commodity by far, this surge in price is bearish for the majority of stock markets. Consequently I would assume that rallies seen since March have either been capped or are unlikely to make much upward progress until investors see evidence that crude oil has commenced a medium-term correction.”
Source: David Fuller, Fullermoney , May 21, 2008.
Richard Russell (Dow Theory Letters): Third phase of bull market is going to be speculative “explosion”
“Let's get back to the markets. As you know, I've been bullish. As a matter of fact, I'm exceedingly bullish. Here's what I think, wrapped up in a nutshell. The greatest bull market in history was born in the early 1980's. It turned out to be a very unorthodox primary bull market. We've gone through the first and most of the second phase of the bull market with the third phase maybe beginning now or maybe just a bit ahead.
“The third phase is going to be ‘something else'. It's going to be the greatest speculative stock market ‘explosion' the world has ever seen. It's going to include (include, hell, it's going to be led) by the BRIC nations (Brazil, Russia, India, China) along with most of Asia and Europe, and it's going to rub off on the poor old indebted US – BIG TIME!
“Right now most of the world's potential investors are sitting on the sidelines reading about ‘how tough it is, and how this is a horrendous real estate disaster and how every other American is going to lose his home due to foreclosure.' But wait – so far the markets are telling us something different. As my subscribers and readers of Barron's know, it's been telling us that the stock market has discounted the bad news and the ‘coming disaster' and is preparing itself for better times ahead.
“I think there's a mighty third phase coming. Most of the world is sitting with cash. There's $3.5 billion in US money market funds. There's God knows how much cash in bonds on the sidelines. There are tens of trillions in sovereign wealth funds that will be looking to be invested. The oil and commodity nations are choking on cash. The planet is up to its neck in fiat money, and once the third phase of the bull market starts cranking up, this money will want to be in stocks.”
Source: Richard Russell, Dow Theory Letters , May 19, 2008.
Michael Masters: Testimony on commodity prices before US Senate
This interesting testimony points the finger squarely at Commodity Index Funds for the recent acceleration in food and energy prices. Here is an extract:
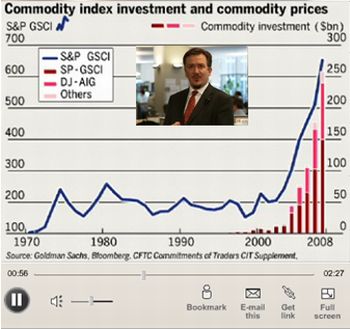
“The following Chart shows this dynamic at work. As money pours into the markets, two things happen concurrently: the markets expand and prices rise.
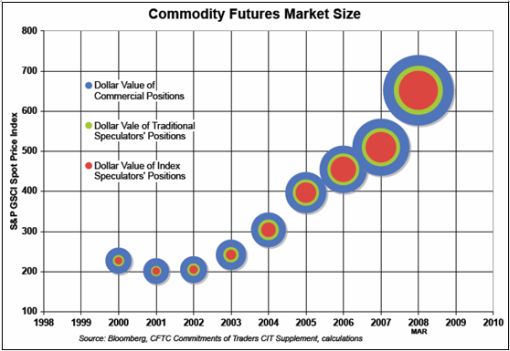
“One particularly troubling aspect of Index Speculator demand is that it actually increases the more prices increase. This explains the accelerating rate at which commodity futures prices (and actual commodity prices) are increasing. Rising prices attract more Index Speculators, whose tendency is to increase their allocation as prices rise. So their profit-motivated demand for futures is the inverse of what you would expect from price-sensitive consumer behavior.
“You can see from the Chart that prices have increased the most dramatically in the first quarter of 2008. We calculate that Index Speculators flooded the markets with $55 billion in just the first 52 trading days of this year.19 That's an increase in the dollar value of outstanding futures contracts of more than $1 billion per trading day. Doesn't it seem likely that an increase in demand of this magnitude in the commodities futures markets could go a long way in explaining the extraordinary commodities price increases in the beginning of 2008?
“There is a crucial distinction between Traditional Speculators and Index Speculators: Traditional Speculators provide liquidity by both buying and selling futures. Index Speculators buy futures and then roll their positions by buying calendar spreads. They never sell. Therefore, they consume liquidity and provide zero benefit to the futures markets.
“It is easy to see now that traditional policy measures will not work to correct the problem created by Index Speculators, whose allocation decisions are made with little regard for the supply and demand fundamentals in the physical commodity markets. If OPEC supplies the markets with more oil, it will have little affect on Index Speculator demand for oil futures. If Americans reduce their demand through conservation measures like carpooling and using public transportation, it will have little affect on Institutional Investor demand for commodities futures.
“Index Speculators' trading strategies amount to virtual hoarding via the commodities futures markets. Institutional Investors are buying up essential items that exist in limited quantities for the sole purpose of reaping speculative profits.
“Think about it this way: If Wall Street concocted a scheme whereby investors bought large amounts of pharmaceutical drugs and medical devices in order to profit from the resulting increase in prices, making these essential items unaffordable to sick and dying people, society would be justly outraged.
“Why is there not outrage over the fact that Americans must pay drastically more to feed their families, fuel their cars, and heat their homes?”
Please click here for the full testimony.
Source: mCADForums.com , May 20, 2008.
Eoin Treacy (Fullermoney): Commodities – keep an eye on further regulation
“The Michael Masters piece is a clear indication that the focus of public opinion is turning towards further regulation, of how large a speculator's positions can be in key commodities. This is important and it would be advisable to keep an eye on government announcements relating to this issue.
“It is easy to forget, with the hyperbole in the media that commodities are in a secular bull market. Regardless of their recent advance, they remain a long way from their inflation-adjusted highs posted in the 1970s. While the impact Commodity Index funds is being examined today, any fresh regulation is unlikely to derail the long-term bullish fundamentals for the sector.”
Source: Eoin Treacy, Fullermoney , May 23, 2008.
John Authers (Financial Times): Speculators cannot take all the blame for price spike in commodities
Source: John Authers, Financial Times , May 20, 2008.
Bloomberg: Blame Wall Street for $135 oil on wrong-way betting
“Oil's rally to a record above $135 a barrel came as traders bought crude to cover wrong-way bets that prices would decline, according to data from the New York Mercantile Exchange.
“The number of outstanding futures contracts, known as open interest, fell 8.1% in a week to 1.36 million at the same time that prices rose 2.6%, the data show. Falling open interest and rising prices are signs that traders are buying to exit so-called short positions that would profit if oil fell, and lose money as they rose.
“‘In a market like today, which is trending higher while open interest is falling, it's a sign that money is moving out of the market,' said Stephen Schork, president of Schork Group in Villanova, Pennsylvania. Open interest in Nymex crude futures peaked this year at 1.5 million on March 13.”
Source: Alexander Kwiatkowski and Grant Smith, Bloomberg , May 22, 2008.
Bloomberg: OPEC says it's powerless to stop rally
“Crude oil rose to a record above $135 a barrel as OPEC ministers said they could do nothing to stop a rally that may be heading to $200 a barrel.
“Oil has risen 19% this month as analysts increased their price forecasts because of supply constraints and demand growth. OPEC has ‘no magic solution' to the surge, Qatar's oil minister said. Prices are ‘out of the hands' of the organization, according to Libya's top oil official.
“‘Everyone's jumped on the bandwagon,' said Anthony Nunan, assistant general manager for risk management at Mitsubishi Corp, Japan's biggest trading company, in Tokyo. ‘There's agreement that $200 is possible and that's getting more people into the market. We have very little supply cushion going forward and that's playing into the minds of investors.'”
Source: Mark Shenk, Bloomberg , May 22, 2008.
CNBC: Why Goldman's oil guru predicts a “super spike”
“Arjun Murti remembers the pain of the oil shocks of the 1970s. But he is bracing for something far worse now: He foresees a ‘super spike' – a price surge that will soon drive crude oil to $200 a barrel.
“Mr. Murti … is not bothered much by the prospect of even higher oil prices, figuring it might finally prompt America to become more energy efficient.
“An analyst at Goldman Sachs, Mr. Murti has become the talk of the oil market by issuing one sensational forecast after another. A few years ago, rivals scoffed when he predicted oil would breach $100 a barrel. Few are laughing now.
“Mr. Murti, 39, argues that the world's seemingly unquenchable thirst for oil means prices will keep rising from here and stay above $100 into 2011. Others disagree, arguing that prices could abruptly tumble if speculators in the market rush for the exits. But the grim calculus of Mr. Murti's prediction, issued in March and reconfirmed two weeks ago, is enough to give anyone pause: in an America of $200 oil, gasoline could cost more than $6 a gallon.
“Mr. Murti is hardly alone in predicting higher oil prices. Boone Pickens, the oilman turned corporate raider, said Tuesday that crude would hit $150 this year. But many analysts are no longer so sure where oil is going, at least in the short term. Some say prices will fall as low as $70 a barrel by year-end, according to Thomson Financial.
“Experts disagree over the supply of oil, the demand for it and whether recent speculation in the commodities markets has artificially raised prices. As an energy analyst at Citigroup, Tim Evans, reportedly put it, trading commodities these days is like ‘sticking your hand in a blender'.”
Source: Louise Story, CNBC , May 21, 2008.
Bill King (The King Report): Top could be forming in oil price
“A very significant top in oil and energy could be forming and fundamentals appear to be changing. Crude oil and gasoline are rallying now on the strong seasonal tendency to rally into the start of ‘drive season', which is Memorial Day Weekend. Then there is usually a retrenchment and another rally.
“The past few years, gasoline has topped after the 4th of July. In 2006 Goldman sharply cut the weighting of gasoline in its commodity indices, which forced funds to sell.
“Last year, gasoline soared after the Labor Day weekend, which is the end of drive season and the strong seasonal gasoline bullishness. This was short covering and reacquisition of long positions because of the underlying fundamental strength in energy. But the global economy is much softer this year.
“Media accounts have Iran and China stockpiling crude oil in tankers and elsewhere. Iran fears that either Bush or Israel might strike before Obama takes over.
“China is stockpiling energy and food for the Olympics. At some point during the Olympics in August, China should know if it has surplus inventory above Olympic demand and possibly earthquake-induced demand. Then China might start dumping surplus commodities – not only to lessen inventories but to push commodities lower to generate better buying opportunities later.
“China has been very adroit in hammering copper and key commodities when prices get too exuberant. Then they buy after the collapse and enter into long-term contracts with producers at the better prices.
“Ergo, there could be short-term tops in oil and gasoline next week and near the 4th of July and then a more significant peak near the Olympics and/or Labor Day.”
Source: Bill King, The King Report , May 20, 2008.
David Fuller (Fullermoney): Gold – where are we in the cycle?
“At Fullermoney, we became born-again bulls of precious metals in 2001. After all, gold had experienced a 21-year bear market; the price action resembled base development; everyone hated the yellow metal except for the much ridiculed gold bugs; Gordon Brown had sold over half the UK's reserves of bullion at the bottom; we lived in a fiat currency world and central banks had been printing money with abandon for years.
“There have been plenty of other reasons to be bullish of gold, discussed by this service, but the present outlook review is mainly concerned about what happens next.
“We have often pointed out that platinum was usually the lead precious metal, both up and down. Since its early March peak, platinum has seen a sharp correction to nearly $1800, successfully tested that low earlier this month, and rallied above some lateral resistance. Consequently, platinum would now need to fall back beneath $2000 to reaffirm resistance from the year's earlier high.
“This is an impressive performance, reasonably consistent with earlier support building phases following accelerated peaks, although they continued for much longer. This was also true for gold and silver.
“I recently pointed out that gold had approached an area of potential support from the mid-$800 region and the moving average. It has subsequently rallied from this level and a close beneath $845 is now required to suggest further easing rather than a period of support building at sideways to higher levels.
“Silver tends to lag platinum and gold in the earlier stages of an advance, before finally attracting strong speculative support which causes it to perform like high-beta gold once again. Nevertheless, silver is now technically interesting as a recovery candidate, following its decline to nearly $16, and would have to close beneath this price to suggest further weakness rather than the sideways to higher support building presently indicated.
“In summary, technical action for precious metals indicates that they are now in accumulation zones, although historical action suggests that they are best purchased on easing during these phases, as ranging can be lengthy. This remains a real prospect, of some concern to me, not least because this is not usually a bullish period seasonally, as I have mentioned before. We are likely to see some central bank selling and perhaps also from the IMF. The traditionally bullish buying in anticipation of Christmas, the Chinese New Year and Indian wedding season occurs between 4Q and 1Q.
“Could it be different this time? If precious metals have a shorter support building phase before retesting their highs and extending the overall upward trends, what would be the catalyst?
“I can think of two factors - liquidity and inflationary expectations. Central banks have pumped plenty of liquidity into the system, as we know, and many investors are currently sitting on historically high levels of cash. Today, few investors remain in denial regarding inflation.
“In conclusion, I think precious metals are in accumulation zones. Given the possibility of further support building, I favour the ‘baby steps' tactic of nibbling on easing and for traders, lightening on rallies.”
Source: David Fuller, Fullermoney , May 19, 2008.
Financial Times: Food prices forecast to stay high for 10 years
“Food prices have undergone a paradigm shift and will not drop back to pre-crisis levels for at least the next 10 years, putting long-term pressure on governments facing the food crisis, according to a forthcoming report.
“The report, by the Organisation for Economic Co-operation and Development and the UN's Food and Agriculture Organisation, will say food prices have moved to a ‘higher plateau' because of rising demand from the biofuels industry and developing countries such as China.
“But the Agricultural Outlook 2008 to 2017, due to be published next week, does offer a respite in the short term, forecasting prices will ease from this year's record levels, according to a summary seen by the Financial Times.
“‘Food prices would be considerably higher in nominal terms than in the past but below the current records,' said an official familiar with the report. “Compared with average prices for 2005 to 2007, the report forecasts that in 2017 the price of wheat, adjusted for inflation, will be 2% higher, rice 1% higher and corn 15% higher. Oilseed prices are expected to be up 33%.
“The price projections imply falls from the current records but suggest that food inflation will continue to be a long-term problem, particularly for poor countries.”
Source: Javier Blas, Financial Times , May 21, 2008.
BCA Research: Bank of Japan on hold
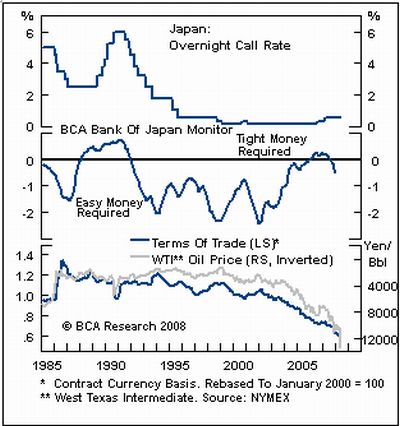
“The Japanese economy remains fragile and will keep the Bank of Japan (BoJ) on hold this year.
“The BoJ opted to leave policy rates unchanged at 0.5%, as expected. Despite the bounce in Q1 GDP, our central bank monitor suggests that economic conditions are sufficiently weak to prevent any monetary tightening this year. In the comments which followed the policy decision, BoJ Governor Shirakawa acknowledged that rising oil and raw-material costs are likely to have ‘a negative effect on capital spending and consumption'.
“Indeed, Japan's terms of trade has a highly negative correlation with crude prices: the business sector is heavily geared towards manufacturing and industrials and contains no resource companies. In turn, rising commodity prices have presented a significant drag on growth and have helped contribute to the dramatic collapse in both business and consumer sentiment over the past several months.
“Bottom line: We remain bearish the yen and overweight JGBs within a global hedged fixed income portfolio.”
Source: BCA Research , May 21, 2008.
Financial Times: Protracted UK slowdown looming, says Bank of England
“The economy is heading for its most protracted slowdown since the early 1990s, according to detailed growth forecasts from the Bank of England that show a sharply widening gap between its and the government's outlook.
“The central bank's forecast for economic growth is significantly below that of the Treasury for the first time since 2005. But with inflation rising and expected to stay high, the bank's Monetary Policy Committee (MPC) made it clear that a long period of weakness was needed to bring inflation back under control.
“The Bank of England's central forecast – issued on Wednesday – is for economic growth to slip from 3.3% in 2007 to 1.5% in 2009. The MPC also thinks that in 2010 – likely to be an election year – there is an even chance growth will be below 2.4%.
“This contrasts with the Treasury's most recent forecast from March, which expects growth of 2.25-2.75% in 2009 and 2.5-3% growth in 2010.
“The chancellor still sees the growth picture as much rosier than the Bank of England. He told the CBI employers' organisation dinner on Tuesday: ‘While the global outlook remains uncertain, I remain optimistic about the underlying strength and resilience of the British economy.'
“The Bank of England also published minutes from the May MPC meeting. The committee voted 8-1 against a rate cut …
“Despite what the minutes described as ‘subdued [growth] for much of the forecast period', the MPC noted the inflation outlook had also deteriorated in recent months. With bad news on both growth and inflation, the majority of the MPC thought a slowdown ‘was likely to be necessary for inflation to settle close to the target around two years ahead'. Any cut in interest rates would create the impression it cared more about growth than hitting the 2% inflation target, the members worried.
“With markets less confident than at any time in the past decade in the Bank's ability to control inflation, the MPC added that ‘the committee's behaviour was likely to have a material influence' on inflation expectations.”
Source: Chris Giles, Financial Times , May 21, 2008.
Financial Times: UK commercial property
“Foreign buyers could be the saving grace of the ailing UK commercial property market, says Jamie Dannhauser at Lombard Street Research.
“He notes that commercial property values continued to fall last month – although the pace of decline has clearly slowed. He adds that confidence and activity remain fragile, notably amongst debt-funded buyers who are largely shut out of the market.
“But Mr Dannhauser believes that with capital values now 17% below their peak of last year and initial yields at 5.5%, there is unlikely to be much more downside for the market as a whole.
“‘The work-out in the commercial property sector should not be prolonged. Unlike the early 1990s, the problem is not one of excess supply, at least outside the City of London office market.'
“He goes on: ‘There are clear downside risks from tighter credit conditions, banks' reduced willingness to lend and the closure of the commercial mortgage-backed securities market. Debt-funded activity is likely to be much reduced into next year.
“‘However, with commercial property now looking fair-to-good value versus gilts, and UK institutions awash with cash, there could well be increased equity interest later on in the year.
“‘Sterling weakness is also likely to be a boon for commercial property prices, as foreign funds plough money into the cheaper UK market.'”
Source: Jamie Dannhauser, Financial Times , May 21, 2008.
Gavekal: Germany facing a rough patch
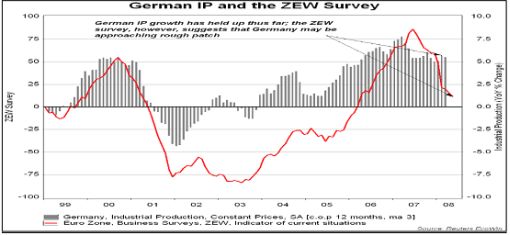
Source: GaveKal – Checking the Boxes , May 21, 2008.
David Fuller (Fullermoney): ECB unlikely to cut rates as long as oil remains strong
“When looking at the potential movements of the ECB it would be wise to remember that they only have one mandate: to control inflation. This is unlike the Fed's numerous goals, such as to achieve high employment, protect the economy, maintain orderly markets and control inflation. All aims other than controlling inflation are considered the responsibility of individual member states.
“Even if it had a growth mandate, the size the of the German economy relative to the rest of the Euro zone means it would have a much greater weighting in any decision making than a country such as Spain.
“Inflation is presently making headline news as oil continues to push higher on an almost daily basis; however food prices have stabilized and are not currently contributing to increases in inflation.
“A stronger euro is one tool against the negative impact of higher inflation from imported commodities, but it is also having a negative effect on companies that consolidate foreign earnings in euros. If oil enters a medium-term correction then it is possible that the ECB will cut rates relatively soon after, but they are unlikely to do so as long as oil remains so strong.”
Source: David Fuller, Fullermoney , May 21, 2008.
By Dr Prieur du Plessis
Dr Prieur du Plessis is an investment professional with 25 years' experience in investment research and portfolio management.
More than 1200 of his articles on investment-related topics have been published in various regular newspaper, journal and Internet columns (including his blog, Investment Postcards from Cape Town : www.investmentpostcards.com ). He has also published a book, Financial Basics: Investment.
Prieur is chairman and principal shareholder of South African-based Plexus Asset Management , which he founded in 1995. The group conducts investment management, investment consulting, private equity and real estate activities in South Africa and other African countries.
Plexus is the South African partner of John Mauldin , Dallas-based author of the popular Thoughts from the Frontline newsletter, and also has an exclusive licensing agreement with California-based Research Affiliates for managing and distributing its enhanced Fundamental Index™ methodology in the Pan-African area.
Prieur is 53 years old and live with his wife, television producer and presenter Isabel Verwey, and two children in Cape Town , South Africa . His leisure activities include long-distance running, traveling, reading and motor-cycling.
Copyright © 2008 by Prieur du Plessis - All rights reserved.
Disclaimer: The above is a matter of opinion and is not intended as investment advice. Information and analysis above are derived from sources and utilizing methods believed reliable, but we cannot accept responsibility for any trading losses you may incur as a result of this analysis. Do your own due diligence.
Prieur du Plessis Archive |
© 2005-2022 http://www.MarketOracle.co.uk - The Market Oracle is a FREE Daily Financial Markets Analysis & Forecasting online publication.