


Crude Oil Crisis Coming to an End?
Commodities / Crude Oil Jun 03, 2008 - 07:02 PM GMTBy: Clif_Droke

 Now that the financial system has been bailed out, it remains for the beleaguered consumer to be rescued from the doldrums he currently faces. When will the consumer finally be freed from the torment that is so prevalent out there? It shouldn't surprise you that the answer will come from today's most talked about culprit: the price of oil.
With oil and gasoline prices through the roof, food prices on the rise and concerns about the stability of the U.S. economy prevalent, it's no wonder that consumer sentiment is at a multi-decade low right now. Take a look at the latest chart below.
It's a foregone conclusion that the consumer will feel much more like spending once he sees oil and gas prices coming down from their vertiginous levels. The good news is that this inevitability may occur sooner than expected.
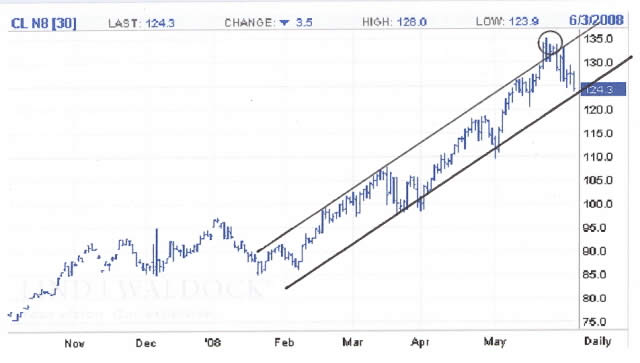
Let's take a look at the recent price history of the oil market. The crude oil chart shown below shows an upside “channel buster” created a temporary exhaustion of the uptrend. Channel busters typically signify tops and turning points in an established trend. This recent channel buster has brought some welcome and much needed relief to what has been a nearly continuous rise in the oil price since February. For now, the 135.00 level remains the benchmark resistance that should keep a lid on the oil price in the near term.
Before we go further into oil price trends, let's shift gears and look for a minute at an important benchmark that is related to the oil price. I'm referring to the Dow Jones Transportation Average (DJTA) and its surprisingly strong bull run.
The doom-and-gloomers aren't convinced that the rally in DJTA has any meaning for the crude oil price or the economy. To be fair, we should ask how much of the recent rally to new highs in the DJTA was related to the “Warren Buffett factor” is up for debate. The famous investor extraordinaire took a high-profile stake in Burlington Northern Santa Fe (BNI), a major component of the Dow Transports, and this highly publicized move may have helped ignite the rails to their recent highs. If so, this would call into question the Dow Theory significance of the rally in the Transportation index in relation to the Dow Industrials.
Be that as it may, the economic consequences of the surge in the DJTA can't be overstated. In the recent past I've argued that while Dow Theory is somewhat outdated as a viable system for predicting bull and bear moves in the broad market, it has never lost its validity as a tool for predicting economic slowdowns and recoveries. In particular, the DJTA is of prime importance as a barometer of future anticipated economic activity. As such, the DJTA lends itself well to predicting the onset of periods of economic expansions and contractions.
As you can see, the DJTA has established a pattern of higher highs and higher lows since January of this year and it has enormous implications for the economy. For one thing it suggests that fuel prices won't be a dominant factor weighing against retailers, consumers and shippers in the months ahead. It also suggests economic improvement should be seen as the year unfolds and by the time the election rolls around, it's doubtful the economy will be much of a hot-button issue anymore.
Now we turn to the 10-month oscillator for the crude oil price, a measure of longer-term overbought and oversold pressures. As you can clearly see, the 10-month oscillator is flashing a huge “overbought” reading which signifies an intermediate term top is in the making.
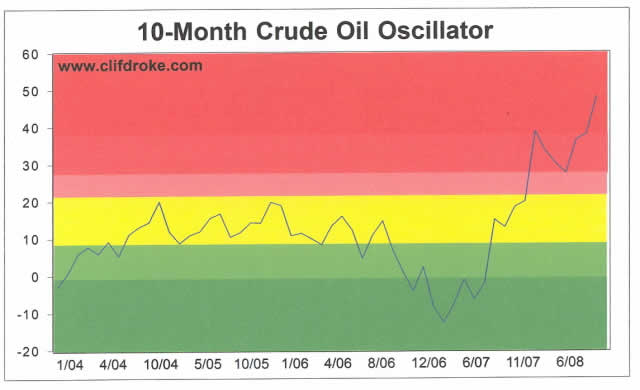
This overbought extreme is portentous, for it means that crude oil will have tremendous overhead resistance to contend with and will be vulnerable to selling pressure in the weeks and months ahead. The sell signal flashed by this indicator suggests that relief is on the way for the consumer as the oil price should gradually back off its all-time highs.
Last but not least, we can't forget that 2008 is a presidential election year. As such, everything that has significance to the consumer and the investor will be highlighted by the mainstream press and blown up into a major hot-button political issue. Oil is certainly one of those highly charged political issues right now. Yet consider the following similarities between oil in the present and oil during the last election year in 2004.
- In 2004 crude soared 53% ($36 to $55) in only 4 months, then fell -27%
- In 2008 crude soars 59% ($85 to $135) in only 4 months, then falls (???)
Here is a chart showing the 2004 crude oil experience from a commentary I wrote at that time. Notice the parabolic nature of the up and down moves in the oil price that year.
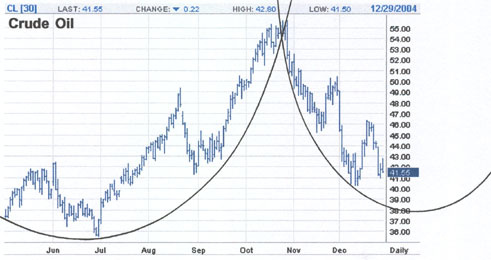
It's no coincidence that a meaningful top in the crude oil price occurred very close to the last presidential election in 2004. This time should be no different as the oil price must come down in order for the massive bail-out and economic relief efforts to take full effect. It is doubtful in the highest that the market controllers would allow a persistent rise in the crude oil price to wreck the economy. Don't be deceived – the oil price is governed by artificial manipulation of supply and demand, not “Peak Oil” as some would have us believe.
Concerning the Peak Oil myth, here's what noted economist Ed Yardeni recently had to say on the topic: “The peak oil hysteria may have triggered a short-covering rally by commercial accounts, i.e., hedgers, who couldn't take any more margin calls or couldn't stand the pain of being locked into prices of $100 or less. While all this has been happening, the oil market ignored rapidly mounting evidence that prices between $100-$150 rather than $150-$200 may be starting to dampen demand and boost supply.”
Yardeni also points out that Russia is cutting taxes on its oil industry to boost investment in new fields and increase oil production. Brazil continues to find more oil offshore in the Santos Basin, which could end up being what he describes as a “contiguous megadeposit” of crude oil. He also points out that “Congress may start considering ending longstanding bans on domestic drilling including overturning moratoriums that limit offshore drilling and accelerating leasing of federal lands (5/23 WSJ).”
Any observer of the history of commodity bull markets will notice that every time a major commodity establishes a long-term rising trend, the stories in the popular press are always “bent to fit the head” of the prevailing trend. The so-called Peak Oil Theory is no exception. What history also teaches is that sooner or later, supply has a way of coming out of the most mysterious cracks and crevices. When it does, it invariably spoils the party for the perma-bulls, who foolishly envision a never-ending rise in the price of their favorite commodity.
Once the oil price comes down and brings gasoline prices down with it, consumer will have a lot less to worry about and economic activity will increase. Another “oil crisis” will be behind us and the markets will have one less thing to worry about.
By Clif Droke
www.clifdroke.com
Clif Droke is the editor of the three times weekly Momentum Strategies Report newsletter, published since 1997, which covers U.S. equity markets and various stock sectors, natural resources, money supply and bank credit trends, the dollar and the U.S. economy. The forecasts are made using a unique proprietary blend of analytical methods involving internal momentum and moving average systems, as well as securities lending trends. He is also the author of numerous books, including "How to Read Chart Patterns for Greater Profits." For more information visit www.clifdroke.com
Clif Droke Archive |
© 2005-2022 http://www.MarketOracle.co.uk - The Market Oracle is a FREE Daily Financial Markets Analysis & Forecasting online publication.