


Stock Market Back into The Bear Suits
Stock-Markets / Stock Markets 2015 Apr 26, 2015 - 09:45 PM GMT

 SPX
SPX
In last week's report we were focused on looking for more upside for the US markets, I was confident that the prior decline was a corrective decline and new all time highs would be seen on the SPX. We could not have asked for more, out plan worked our well, much better than I had thought.
SPX Chart
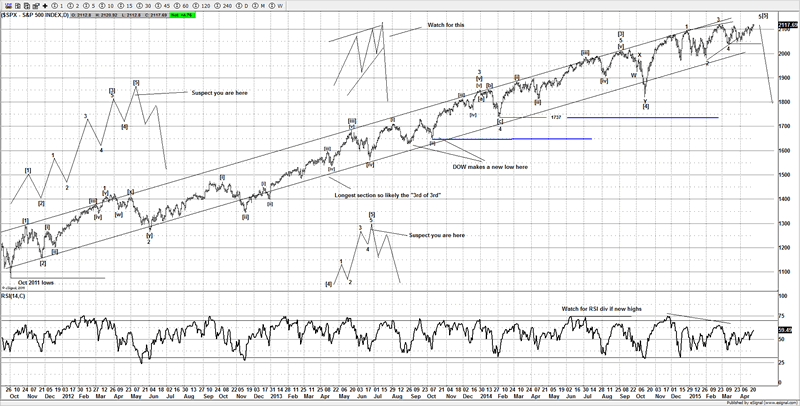
With the majority of bears looking for a 12 12 setup and a 3rd wave crash, we again faded the bearish crowd and were focused on looking higher, virtually a mirror image of what we did at the February 2015 lows. With the SPX making a new all time highs it's fulfilled the minimum requirements of the pattern, although the DOW has to make a new all time high, so I favor that we see a new all time high to align with the SPX idea.
DOW
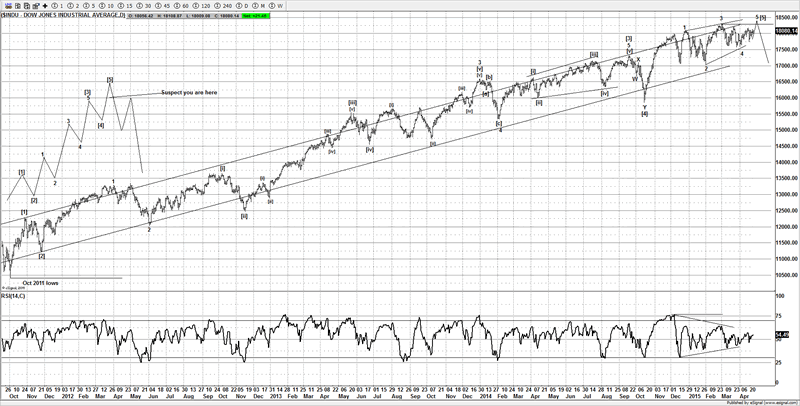
The DOW could do with making a new all time high to potentially complete a possible ending diagonal which in turn could end a larger 5 wave move from the October 2011 lows. Once the DOW puts in the new all time highs its then I will start to look for evidence of a major turn. Ideally most that were bearish at the recent lows will have been stopped out and turned bullish.
Dow Chart 1
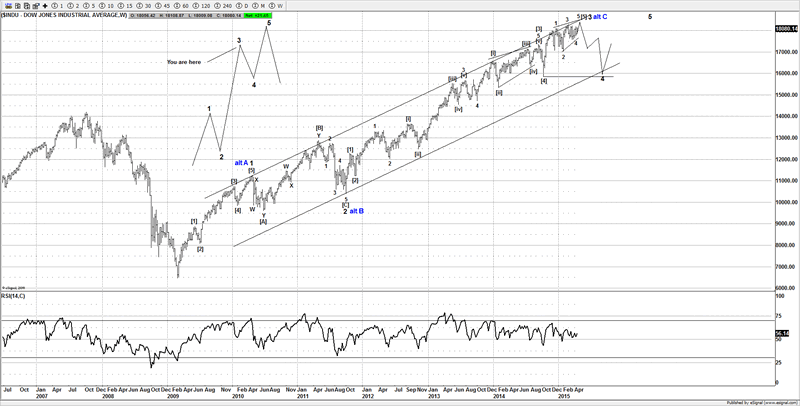
I suspect the larger 5 wave move from October the 2011 lows could be ending wave 3 (alt wave C) from the March 2009 lows, so a substantial decline could be close by for wave 4 on both the DOW and SPX as shown.
Dow Chart 2
Dow Chart 3
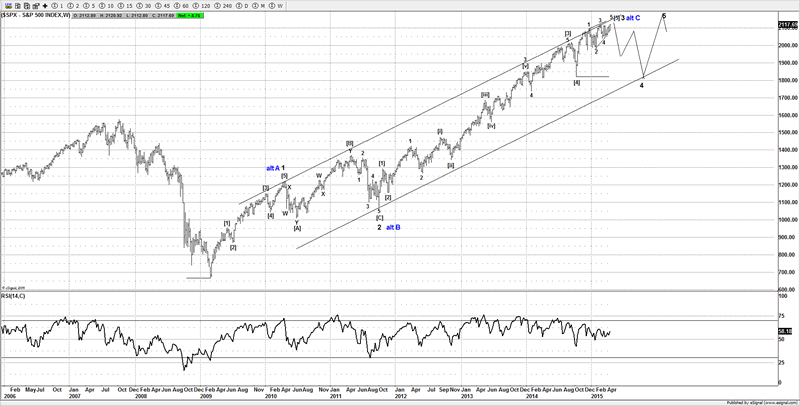
Even a pullback to 1800SPX & DOW 16000 would not really do any real damage to the upside trend but I think it would do enough to reset the trend and correct the move from the October 2011 lows.
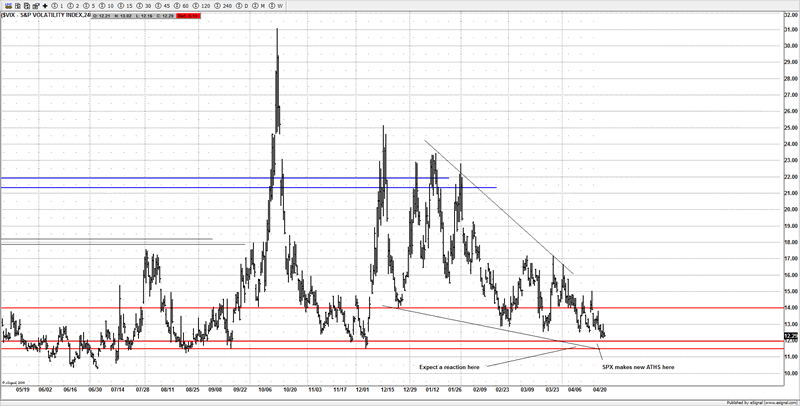
VIX
The VIX has pushed lower as we suspected it would, it's moving nicely towards our target area, but with the DOW expected to make a new all time high, I favor the idea that the SPX pushes higher, so the VIX can push lower under 12.00.
VIX Chart 1
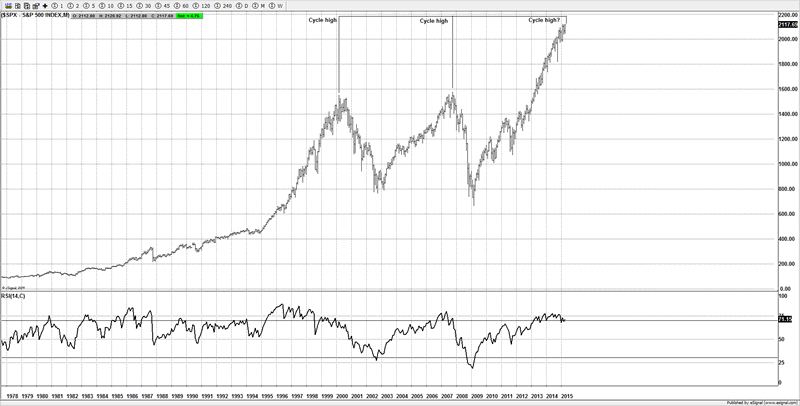
There is also the cycle chart I have posted before and that could potentially argue for a major peak in May as well.
SPX Chart 2
So with the potential wedge (ending diagonal), the VIX bullish falling wedge and the cycle timing chart I can make a very valid case that we can see a substantial reversal from the current area, although I want to see a bit more upside, we may get that early next week. We are going to need some sort of reversal clue before we can start to get bearish, having stayed bullish for the majority of this year; it's only now that I have started to jump back into the bear suit again. I think May could be setting up for some fireworks and offer aggressive traders, opportunities in both directions.
Have a profitable week ahead.
Click here to become a member
You can also follow us on twitter
What do we offer?
Short and long term analysis on US and European markets, various major FX pairs, commodities from Gold and silver to markets like natural gas.
Daily analysis on where I think the market is going with key support and resistance areas, we move and adjust as the market adjusts.
A chat room where members can discuss ideas with me or other members.
Members get to know who is moving the markets in the S&P pits*
*I have permission to post comments from the audio I hear from the S&P pits.
If you looking for quality analysis from someone that actually looks at multiple charts and works hard at providing members information to stay on the right side of the trends and making $$$, why not give the site a trial.
If any of the readers want to see this article in a PDF format.
Please send an e-mail to Enquires@wavepatterntraders.com
Please put in the header PDF, or make it known that you want to be added to the mailing list for any future articles.
Or if you have any questions about becoming a member, please use the email address above.
If you like what you see, or want to see more of my work, then please sign up for the 4 week trial.
This article is just a small portion of the markets I follow.
I cover many markets, from FX to US equities, right the way through to commodities.
If I have the data I am more than willing to offer requests to members.
Currently new members can sign up for a 4 week free trial to test drive the site, and see if my work can help in your trading and if it meets your requirements.
If you don't like what you see, then drop me an email within the 1st 4 weeks from when you join, and ask for a no questions refund.
You simply have nothing to lose.
By Jason Soni AKA Nouf
© 2015 Copyright Jason Soni AKA Nouf - All Rights Reserved
Disclaimer: The above is a matter of opinion provided for general information purposes only and is not intended as investment advice. Information and analysis above are derived from sources and utilising methods believed to be reliable, but we cannot accept responsibility for any losses you may incur as a result of this analysis. Individuals should consult with their personal financial advisors.
WavePatternTraders Archive |
© 2005-2022 http://www.MarketOracle.co.uk - The Market Oracle is a FREE Daily Financial Markets Analysis & Forecasting online publication.