


Stocks, Bonds and Real Estate Financial Hurricanes Headed Our Way - No Where to Hide!
Stock-Markets / Financial Crash Apr 28, 2015 - 05:33 PM GMTBy: James_Quinn

 There are three financial hurricanes hurtling towards our country and most people are oblivious to the coming catastrophe. The time to prepare is now, not when the hurricane warnings are issued.
Hussman makes his usual solid case that stocks and bonds are as overvalued as they have ever been in the history of investing. People are under the false impression that bonds are always a safe investment. The fact that you are already getting a negative real return on bonds doesn’t seem to compute with math challenged Americans. Over the next ten years you will absolutely lose money in bonds.
Liquidity in both the stock and bond markets is thinning considerably. In bonds, quantitative easing by global central banks has resulted in a scarcity of available collateral, a collapse in repo liquidity, and increasing frequency of delivery failures, all of which is shorthand for a bond market that is becoming less liquid and more fragile to any credit event. Meanwhile, risk premiums are minuscule. Avoiding a negative total return on 10-year bonds now requires that interest rates must not rise by even one percentage point over the next three years. Bond yields have historically covered investors against a meaningful change in yields before resulting in negative total returns. On a one-year return horizon, bond yields presently cover investors for a yield change amounting to only about 0.25 standard deviations – matching mid-2012 as the lowest level of yield coverage in history.
The fragility of the economic, financial, and social systems of the U.S. is at extreme levels. The median American household has less real income than they had in 1989. The social fabric of the country is tearing as we speak, with Baltimore and Ferguson as the warning shots of coming chaos and civil strife. The ruling elite control the monetary system, so the rigged financial markets continue to rise and have reached bubble proportions. An unexpected pin will be along shortly to pop the bubble. The next crash will make 2008 look like a walk in the park. It may be decades until markets reach these levels again.
Market crashes always reflect two features: extremely thin risk premiums in an environment where investors have shifted toward greater risk-aversion, and lopsided selling into an illiquid market. Under present conditions, we observe the precursors for both. That doesn’t force or ensure a crash, but it creates the underlying fragility that allows one.
Last week, the Nasdaq Composite finally clawed its way to breakeven, 15 years after its spectacular bubble peak in 2000. It’s a testament to the overvaluation of technology stocks in 2000 that it has required the third equity bubble in 15 years to reclaim that 2000 high, at least briefly. As you may remember, the Nasdaq Composite reached its intra-day high of 5132.52 in March 2000, plunging to 795.25 (down -78%) by October 2002. The Nasdaq 100, representing the most glamourous of the group, peaked at 4816.25 in March 2000, plunging to 795.25 (down 83%) by October 2002. Even a decade later, in 2010, both indices were still 60-65% below their 2000 highs. The 2000-2002 decline also took the S&P 500 down by half, wiping out the entire total return of the S&P 500 – in excess of Treasury bill returns – all the way back to May 1996.
The S&P 500 presently teeters near its all-time high at 2,115. Its fair value, based upon multiple historically accurate valuation models is 940. Therefore, this market would have to drop 56% to reach fair value. In the real world, crashes often exceed fair value to the downside. Is there anyone you know prepared for a 50% to 60% decline in the stock market?
On the basis of valuation measures best correlated with actual subsequent market returns, we can say with a strong degree of confidence that the S&P 500 would presently have to drop to the 940 level in order for investors to expect a historically normal 10-year total return of 10% annually. That 940 figure for the S&P 500 would not represent some extreme, catastrophic outcome. It’s not a level that would even represent undervaluation from a historical perspective. It’s the level that we would associate with average, historically run-of-the-mill long-term equity returns. As we observed at the 2000 peak, “if you understand values and market history, you know we’re not joking.”
Many will call Hussman a prophet of doom or the little investment adviser who cried wolf. But, he has been here before. He didn’t buckle to peer pressure in 2000 or 2007. He analyzed the data and reached a logical conclusion. We all know bubbles can grow to epic proportions based on delusion, hope, and lies. Hussman was right in 2000. Hussman was right in 2007. And Hussman will be right this time.
You’ll recall we also made similarly “preposterous” comments in April 2007 (see Fair Value – 40% Off). Though our measures of market internals would finally turn negative in late-July of that year (see Market Internals Go Negative), the S&P 500 was already within 10% of its pre-collapse high of 1565 by April. At the time, we estimated reasonable valuations to be “about 40% below current levels,” adding:
“Again, that doesn’t imply that stocks have to actually suffer a decline of that magnitude. Nor do we need such a decline in order to justify an unhedged investment stance. It’s just that investors should not expect the S&P 500 to reliably deliver long-term returns of 10% annually or better until it does. You’ll note that there are also points in history when the S&P 500 traded substantially below that 10% valuation line. Those were points where stocks were priced to deliver long-term returns reliably above 10% annually, and in fact, they did exactly that.”
By late-October 2008, the S&P 500 had indeed declined by well over 40% from its peak, at which point we observed that stocks were no longer overvalued (see Why Warren Buffett is Right and Why Nobody Cares).
The numbers speak for themselves. There is no new paradigm. The Fed is not infallible. The economy is already in recession. Corporate revenues and profits are falling. The consumer isn’t consuming. The market is being elevated by nothing but Wall Street hot air and HFT computers. This time is not different.
To fully understand the present valuation extreme, recognize that the market cap/GDP ratio is currently about 1.29 versus a pre-bubble norm of just 0.55, with “secular” lows such as 1982 taking the ratio to about 0.33. To fully understand the present valuation extreme, recognize that the S&P 500 price/revenue ratio is currently about 1.80, versus a pre-bubble norm of just 0.8, with “secular” lows taking the ratio to about 0.45.”
As for other investors, the worst mistake they made prior to the 2000-2002 collapse was to believe Wall Street’s claims that stocks were not in a bubble, and that this time was different. The worst mistake that other investors made prior to the 2007-2009 collapse was to believe Wall Street’s claims that stocks were not in a bubble, and that this time was different. The worst mistake that other investors are making today is to believe Wall Street’s claims that stocks are not in a bubble, and that this time is different.
Even brilliant investors can lose their nerve and capitulate to the trend and to peer pressure. Don’t be stupid. Don’t believe Wall Street. Don’t let them screw you again. Get your money out of the market.
Last month, Stan Druckenmiller recounted his own experience with capitulation and performance chasing when he was the lead portfolio manager for George Soros and the Quantum Fund:
“I’ll never forget it. January of 2000 I go into Soros’ office and I say I’m selling all the tech stocks, selling everything. This is crazy… Just kind of as I explained earlier, we’re going to step aside, wait for the next fat pitch. I didn’t fire the two gun slingers. They didn’t have enough money to really hurt the fund, but they started making 3 percent a day, and I’m out. It’s driving me nuts. I mean, their little account is like up 50% on the year. I think Quantum was up seven. It’s just sitting there.
“So like around March I could feel it coming. I just – I had to play. I couldn’t help myself. And three times during the same week I pick up a – don’t do it. Don’t do it. Anyway, I pick up the phone finally. I think I missed the top by an hour. I bought $6 billion worth of tech stocks, and in six weeks I had left Soros and I had lost $3 billion in that one play. You ask me what I learned. I didn’t learn anything. I already knew I wasn’t supposed to do that. I was just an emotional basket case and couldn’t help myself. So maybe I learned not to do it again, but I already knew that.”
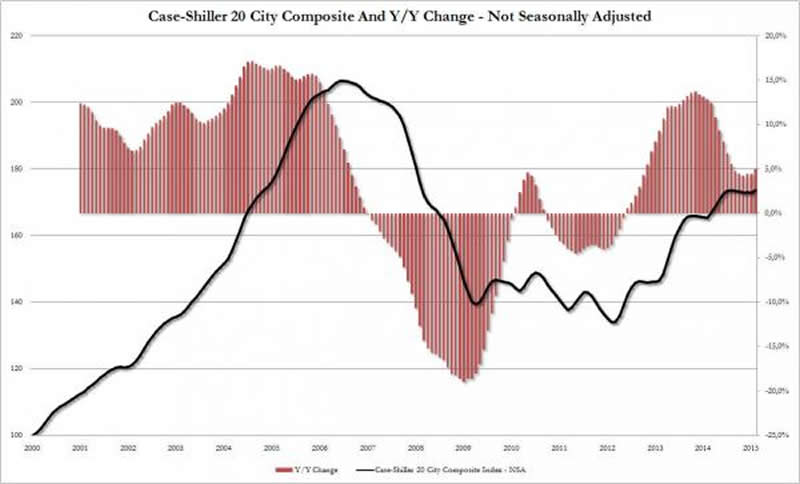
Hussman doesn’t address real estate in his weekly letter, but that is the third hurricane headed our way. Despite home ownership reaching three decade lows, stagnant real wage growth, and an economy that has never truly come out of the 2008/2009 recession, home prices have somehow risen 30% since 2012. The combination of keeping foreclosures off the market, the Wall Street hedge fund buy and rent scheme, Chinese billionaires parking their ill-gotten gains in US high end houses, FHA, Fannie, and Freddie encouraging low down payment mortgages, and the return of flippers has produced an echo bubble in the housing market. Home prices are only 18% from the 2006 all-time high. This bubble will burst congruently with the stock and bond bubbles. Anyone who has bought a house with a low down payment since 2012 is going to be deeply underwater in the next few years. Book it.
Hussman, myself and a few other bloggers will be scoffed at for our warnings. That’s alright. I have thick skin. I don’t really give a shit what anyone thinks about me or my opinions. I deal with facts. As Hussman wrote in 2000, the question now is only about when. It isn’t years. It’s months, weeks or days.
“The issue is no longer whether the current market resembles those preceding the 1929, 1969-70, 1973-74, and 1987 crashes. The issue is only – are conditions more like October of 1929, or more like April? Like October of 1987, or more like July? If the latter, then over the short term, arrogant imprudence will continue to be mistaken for enlightened genius, while studied restraint will be mistaken for stubborn foolishness. We can’t rule out further gains, but those gains will turn bitter… Let’s not be shy: regardless of short-term action, we ultimately expect the S&P 500 to fall by more than half, and the Nasdaq by two-thirds. Don’t scoff without reviewing history first.”
– Hussman Econometrics, February 9, 2000
Join me at www.TheBurningPlatform.com to discuss truth and the future of our country.
By James Quinn
James Quinn is a senior director of strategic planning for a major university. James has held financial positions with a retailer, homebuilder and university in his 22-year career. Those positions included treasurer, controller, and head of strategic planning. He is married with three boys and is writing these articles because he cares about their future. He earned a BS in accounting from Drexel University and an MBA from Villanova University. He is a certified public accountant and a certified cash manager.
These articles reflect the personal views of James Quinn. They do not necessarily represent the views of his employer, and are not sponsored or endorsed by his employer.
© 2015 Copyright James Quinn - All Rights Reserved
Disclaimer: The above is a matter of opinion provided for general information purposes only and is not intended as investment advice. Information and analysis above are derived from sources and utilising methods believed to be reliable, but we cannot accept responsibility for any losses you may incur as a result of this analysis. Individuals should consult with their personal financial advisors.
James Quinn Archive |
© 2005-2022 http://www.MarketOracle.co.uk - The Market Oracle is a FREE Daily Financial Markets Analysis & Forecasting online publication.