


Crude Oil Price Meets Solid Resistance
Commodities / Crude Oil May 05, 2015 - 02:31 PM GMTBy: Nadia_Simmons

 Trading position (short-term; our opinion): No positions are justified from the risk/reward perspective.
Although crude oil hit a fresh 2015 high on Friday, an increase in Iraq's export levels and a stronger greenback weighed on investors' sentiment and pushed the commodity lower. As a result, light crude lost 0.85% and closed the day under the previous high. Where will crude oil head next in the coming week?
On Friday, Baker Hughes showed in its weekly report that oil rigs fell by 24 last week to 679. With this drop, the number of active rigs has fallen for a record 21 weeks in a row (the lowest level since September 2010), but the pace of slowdown continued to decrease, which raised worries over another increase in domestic crude oil inventories.
Additionally, a stronger greenback and Thursday's news that OPEC's supply levels climbed to 31.04 million barrels per day in April (which was the highest level in two years), while Iraq's export levels increased to a record-high of 3.08 million bpd pushed the price of crude oil lower. As a result, the commodity closed the previous week under the solid resistance zone. Will we see a breakout above it in the coming week? (charts courtesy of http://stockcharts.com).
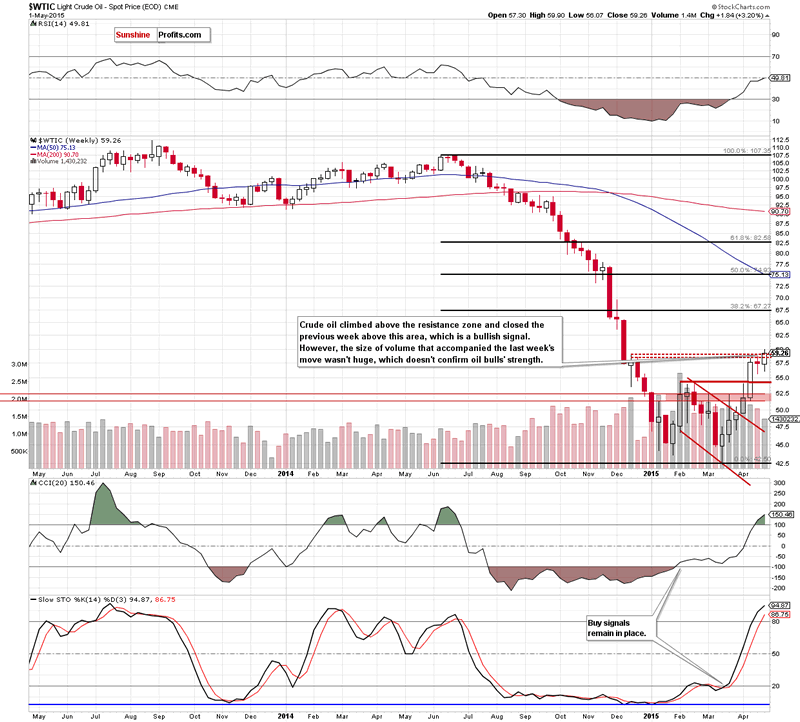
The first thing that catches the eye on the weekly chart is a breakout above the resistance zone created by the Dec 15 and Dec 22 highs. Additionally, the commodity closed the week above it, which is a bullish signal. However, when we take a closer look at the chart, we notice that the size of volume that accompanied last week's upward move wasn't huge (compared to what we saw at the beginning of the month). This means that oil bulls might not be as strong as it seems at the first sight. On top of that, the current position of the indicators (the CCI and Stochastic Oscillator are overbought) suggests that reversal is just around the corner (even if oil bulls try to push light crude higher and test the barrier of $60 once again).
Are there any other factors that could stop the rally?
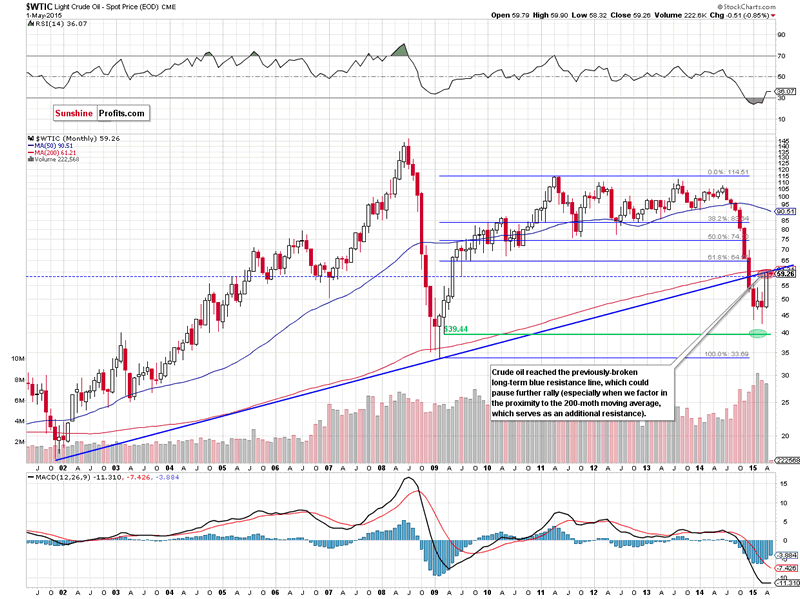
Looking at the monthly chart, we see that crude oil re-tested the previously-broken long-term blue resistance line, but as you see on the chart, this solid resistance in combination with the 200-mont moving average (which serves as an additional barrier for oil bulls) stopped further improvement. Therefore, we believe that as long as there is no breakout above this area further improvement is not likely to be seen and correction of the recent rally should not surprise us.
How low could the commodity go? Let's examine the daily chart and find out.
In our previous Oil Trading Alert, we wrote the following:
(...) the commodity reversed and closed the day below the previous high, invalidating earlier breakdown. Additionally, the size of volume that accompanied yesterday's increase is quite small (compared to what we saw in mid-Apr), which doesn't confirm oil bulls' strength (...) there are negative divergences between the RSI, CCI, Stochastic Oscillator and the commodity (...), which is a negative signal. All the above doesn't bode well for crude oil and suggests that the space for further growth might be limited (...) (even if oil bulls try to push light crude higher and test the barrier of $60
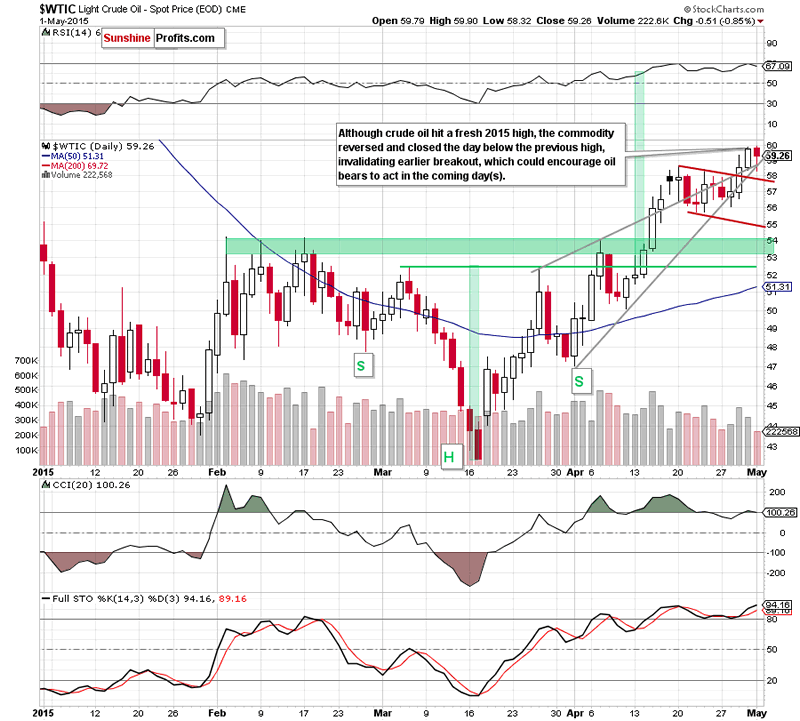
As you see on the daily chart, the situation developed in line with the above scenario. Although crude oil moved little higher and hit a fresh 2015 high of $59.90, all negative signals from our last commentary in combination with the long-term resistance zone encouraged oil bears to act. As a result, light crude slipped to the grey support lines, which triggered a rebound in the following hours. Despite this increase, the commodity closed the day below the previous high, invalidating earlier breakdown (similarly to what we saw on Wednesday). This is a negative signal, which suggests that further deterioration is just around the corner (even if oil bulls try to push light crude higher and test the barrier of $60 once again).
If this is the case, and the commodity declines below grey support lines, the initial downside target would be around $57.70, where the upper border of the declining trend channel is. If it is broken, we could see a drop to around $55 (the lower line of the formation) or even to the green support zone based on the Feb highs ($53.99-54.24).
Summing up, although crude oil hit a fresh 2015 high and closed the previous week above the Dec 15 and Dec 22 highs, the solid resistance zone created by the long-term blue resistance line and the 200-month moving average(marked on the monthly chart) still keeps gains in check. Therefore, we believe that as long as there is no breakout above this area further improvement is not likely to be seen and correction of the recent rally should not surprise us (especially when we factor in an invalidation of the breakout above the previous high and the size of volume that accompanied last week's upward move).
Very short-term outlook: mixed with bearish bias
Short-term outlook: mixed
MT outlook: mixed
LT outlook: bullish
Trading position (short-term; our opinion): No positions.
Thank you.
Nadia Simmons
Forex & Oil Trading Strategist
Przemyslaw Radomski
Founder, Editor-in-chief
Sunshine Profits: Gold & Silver, Forex, Bitcoin, Crude Oil & Stocks
Stay updated: sign up for our free mailing list today
* * * * *
Disclaimer
All essays, research and information found above represent analyses and opinions of Nadia Simmons and Sunshine Profits' associates only. As such, it may prove wrong and be a subject to change without notice. Opinions and analyses were based on data available to authors of respective essays at the time of writing. Although the information provided above is based on careful research and sources that are believed to be accurate, Nadia Simmons and his associates do not guarantee the accuracy or thoroughness of the data or information reported. The opinions published above are neither an offer nor a recommendation to purchase or sell any securities. Nadia Simmons is not a Registered Securities Advisor. By reading Nadia Simmons’ reports you fully agree that he will not be held responsible or liable for any decisions you make regarding any information provided in these reports. Investing, trading and speculation in any financial markets may involve high risk of loss. Nadia Simmons, Sunshine Profits' employees and affiliates as well as members of their families may have a short or long position in any securities, including those mentioned in any of the reports or essays, and may make additional purchases and/or sales of those securities without notice.
© 2005-2022 http://www.MarketOracle.co.uk - The Market Oracle is a FREE Daily Financial Markets Analysis & Forecasting online publication.