


Commodities on the Rebound
Commodities / CRB Index May 14, 2015 - 09:38 PM GMTBy: Tony_Caldaro

 The last commodity update, https://caldaro.wordpress.com/2013/05/19/commodity-bear-market/, detailed our bearish view on most of the sectors. Since then many of the commodity sectors have sold off during 2013/2014. This update will suggest some sectors may have just started Primary wave counter-trend rallies that could last for a few years. First a look at commodities in general.
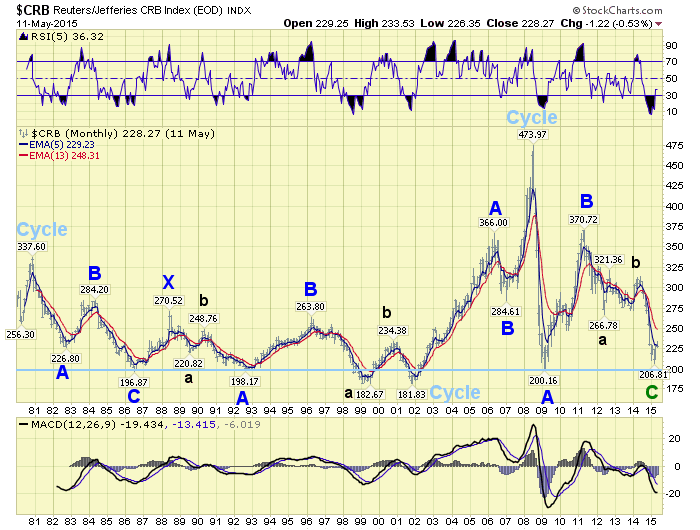
The CRB was the standard to measure the commodity index until Goldman Sachs introduced a consumption weighted index, the GTX. Notice the 21 year bear market pattern in the CRB from 1980-2001, a double three (abc-x-abc). A similar pattern should unfold during the current 20 year bear market.
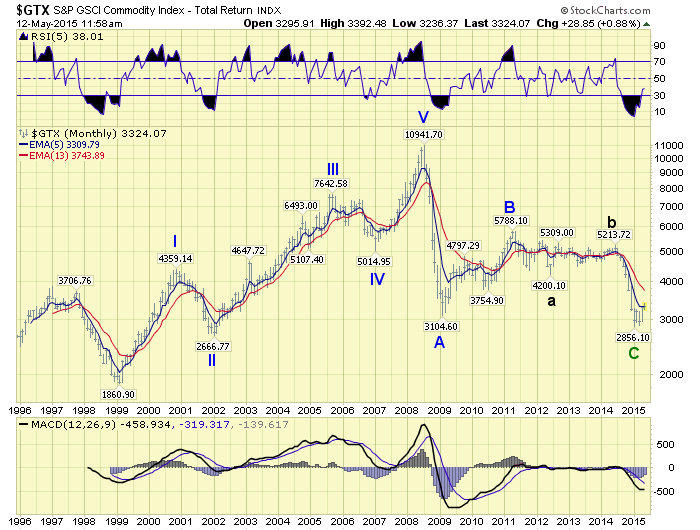
The GTX displays a slightly different pattern for its bull market from 1999-2008. While the CRB was late to get started, and only displayed an abc. The GTX started earlier and completed a five wave pattern into its bull market high. After that high they both begin to look quite similar. Recently, however, the GTX appears to have completed a complex flat from 2008-2015. This suggest a bear market counter-trend X wave may be underway from the recent low, lasting a few years, with a potential to rise back to around 5,000.
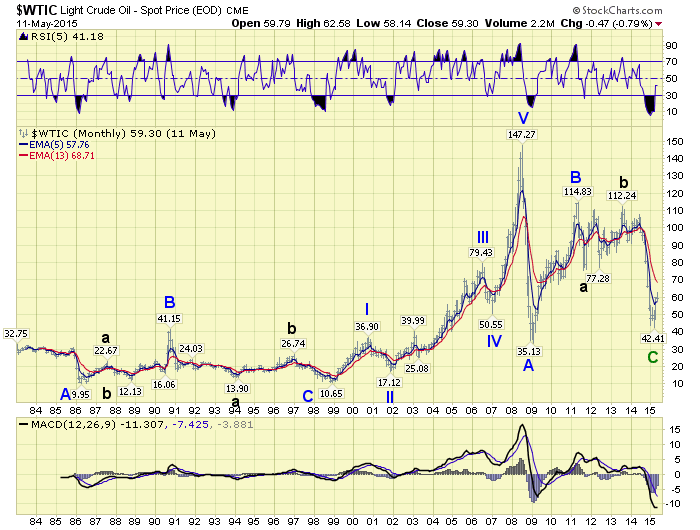
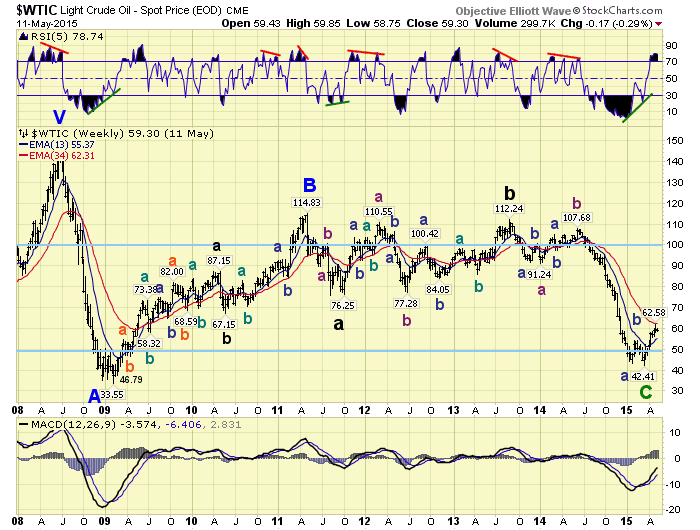
Since Crude oil is heavily weighted in the GTX this is goods news for the producers. The recent low has created a failed flat here, which is generally more positive. In fact, over the next few years, Crude could trade between $50 and $100. But the rise will probably be choppy like the B wave rally between 2009 and 2011, see below.
CHARTS: http://stockcharts.com/public/1269446/tenpp
http://caldaroew.spaces.live.com
After about 40 years of investing in the markets one learns that the markets are constantly changing, not only in price, but in what drives the markets. In the 1960s, the Nifty Fifty were the leaders of the stock market. In the 1970s, stock selection using Technical Analysis was important, as the market stayed with a trading range for the entire decade. In the 1980s, the market finally broke out of it doldrums, as the DOW broke through 1100 in 1982, and launched the greatest bull market on record.
Sharing is an important aspect of a life. Over 100 people have joined our group, from all walks of life, covering twenty three countries across the globe. It's been the most fun I have ever had in the market. Sharing uncommon knowledge, with investors. In hope of aiding them in finding their financial independence.
Copyright © 2015 Tony Caldaro - All Rights Reserved Disclaimer: The above is a matter of opinion provided for general information purposes only and is not intended as investment advice. Information and analysis above are derived from sources and utilising methods believed to be reliable, but we cannot accept responsibility for any losses you may incur as a result of this analysis. Individuals should consult with their personal financial advisors.
Tony Caldaro Archive |
© 2005-2022 http://www.MarketOracle.co.uk - The Market Oracle is a FREE Daily Financial Markets Analysis & Forecasting online publication.