


Stock Market Correction Appears Underway
Stock-Markets / Stock Markets 2015 Jun 06, 2015 - 06:50 PM GMTBy: Tony_Caldaro

 The market started the week at SPX 2107. A gap up opening on Monday took the SPX to 2119. Then a gap down opening Tuesday took the SPX down to last week’s low at 2099. But the market gapped up on Wednesday carrying the SPX to 2122. Then a gap down Thursday open eventually led to breaking last week’s low and hitting SPX 2086. For the week the SPX/DOW were -0.80%, the NDX/NAZ were -0.35%, and the DJ World index was -1.10%. On the economic front reports came in quite positive. On the uptick: personal income, PCE, construction spending, ISM manufacturing, ADP, payrolls, consumer credit, plus the trade deficit and weekly jobless claims improved. On the downtick: factory orders, ISM services, WLEI, and the unemployment rate rose. Next week’s reports are highlighted by Retail sales, the PPI and Export/Import prices.
LONG TERM: bull market
While many market pundits remain focused on the current worries of the day: Greece, the FED’s first rate rise in nine years, a lofty SPX PE of 20, and the rising USD. They seem to forget the ECB, and several other countries, are, and have been, in QE mode for some time. Yes, all of the European indices are currently in confirmed downtrends. Yet, they have had big rallies over the past several months. Over the past few weeks the Greek debt drama, and rising long term rates, have given European bullish investors a reason to pause. In the US, during this entire period, the SPX has remained range bound (2055 80 points) for more than seven months. With three uptrends, two intervening downtrends, and probably another downtrend underway.
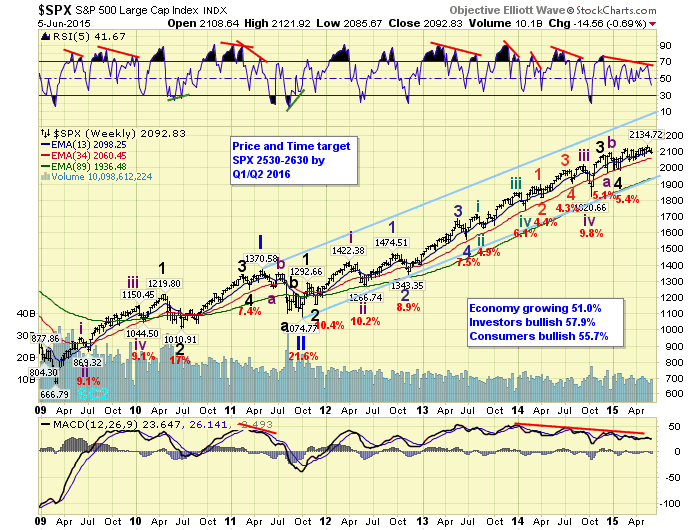
In the meantime the Cycle wave [1] bull market continues to unfold. Primary waves I and II, of this five primary wave bull market, completed in 2011. Primary wave III has been under since then, and is expected to last into 2016. Then after the largest correction since 2011 for Primary IV, Primary V should kick in and carry the market to all time new highs by 2017. So while many are focused on the here and now. This market continues to look bullish for at least another two years.
MEDIUM TERM: downtrend probably underway
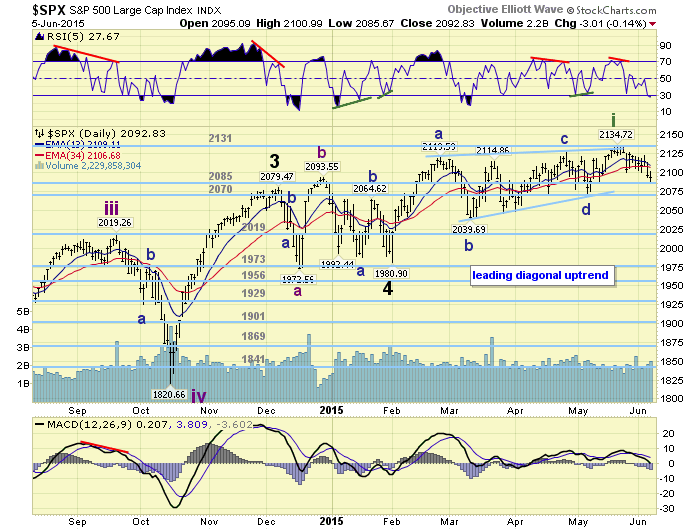
After a very choppy uptrend, from early-February to mid-May, a downtrend/correction appears to underway. We have been labeling this uptrend as a leading diagonal triangle for Intermediate wave i of Major wave 5. The correction that should follow would be Intermediate wave ii. When concluded a fairly strong Intermediate wave iii is then expected.
Last week we noted several medium term negatives that should start to pressure the US market. Negative divergences on monthly, weekly, and even some daily charts. Seven of eight, now all eight, European indices are in confirmed downtrends, and six of eight Asian indices. This week we can add the NYSE and the NYAD in confirmed downtrends, as well as, four of the nine SPX sectors. Market internals continue to weaken as we await a downtrend confirmation. Medium term support remains at the 2085 and 2070 pivots, with resistance at the 2131 and 2198 pivots.
SHORT TERM
In late-February the market made an all time high of SPX 2120. Two and a half months later, while still in an uptrend, the market made a new all time high at SPX 2135. Not even a 1% gain in 2.5 months. Since that high the market has been doing similar choppy activity on the way down. Assuming this potential correction is Intermediate wave ii we have labeled it as follows. Minute a SPX 2099, Minute b SPX 2126, and Minute c SPX 2099 to complete a complex flat for Minor wave a. Then a three wave Minor b rally to SPX 2122. This has been followed, thus far, by four waves: 2102-2113-2086-2101 for part of Minor c. Since there are no overlaps, we currently consider this last decline as part of Minute a of Minor c.
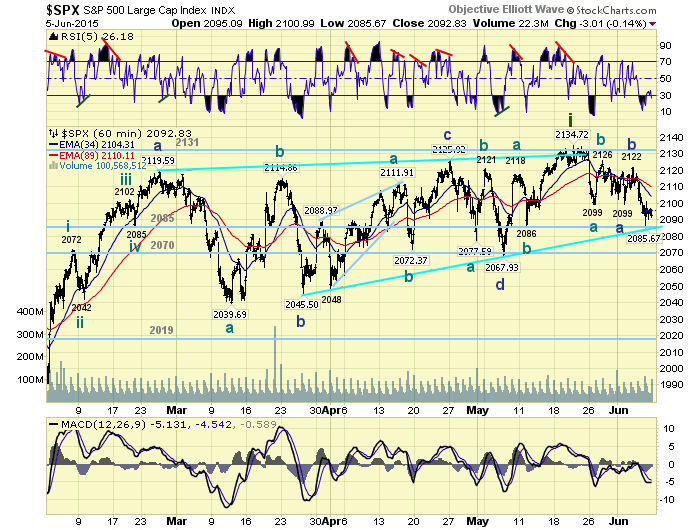
Fibonacci retracements, for this potential downtrend, are: 50% @ SPX 2058, and 61.8% @ SPX 2040. The internal count of the potential downtrend offers some additional levels for Minor wave c: 1.618 a @ SPX 2064, 2.0 a @ SPX 2050 and 2.618 a @ SPX 2028. As you know we have been expecting a decline into the low SPX 2040’s, or worse case the 2019 pivot range. That view has not changed for quite a while. Short term support is at the 2085 and 2070 pivots, with resistance at SPX 2099/2101 and SPX 2118/2122. Short term momentum ended the week oversold.
FOREIGN MARKETS
The Asian indices had some big moves this week, mostly down, and ended -0.9%.
The Europe indices were all lower, ending -2.3%.
The Commodity equity group was mixed but lost 1.8%.
The DJ World index confirmed a downtrend, for the first time since December, and lost 1.1%.
COMMODITIES
Bonds were under pressure this week, remain in a downtrend, and lost 1.9%.
Crude was also under pressure and lost 1.8%.
Gold confirmed a downtrend and lost 1.9%.
The USD had some volatile days, is still trying to confirm and uptrend, but lost 0.6%.
NEXT WEEK
Tuesday: Wholesale inventories. Wednesday: Budget deficit. Thursday: weekly Jobless claims, Retail sales, Export/Import prices and Business inventories. Friday: the PPI and Consumer sentiment. Best to your weekend and week!
CHARTS: http://stockcharts.com/public/1269446/tenpp
After about 40 years of investing in the markets one learns that the markets are constantly changing, not only in price, but in what drives the markets. In the 1960s, the Nifty Fifty were the leaders of the stock market. In the 1970s, stock selection using Technical Analysis was important, as the market stayed with a trading range for the entire decade. In the 1980s, the market finally broke out of it doldrums, as the DOW broke through 1100 in 1982, and launched the greatest bull market on record.
Sharing is an important aspect of a life. Over 100 people have joined our group, from all walks of life, covering twenty three countries across the globe. It's been the most fun I have ever had in the market. Sharing uncommon knowledge, with investors. In hope of aiding them in finding their financial independence.
Copyright © 2015 Tony Caldaro - All Rights Reserved Disclaimer: The above is a matter of opinion provided for general information purposes only and is not intended as investment advice. Information and analysis above are derived from sources and utilising methods believed to be reliable, but we cannot accept responsibility for any losses you may incur as a result of this analysis. Individuals should consult with their personal financial advisors.
Tony Caldaro Archive |
© 2005-2022 http://www.MarketOracle.co.uk - The Market Oracle is a FREE Daily Financial Markets Analysis & Forecasting online publication.