


Stock Market Reluctant Primary Wave IV?
Stock-Markets / Stock Markets 2015 Aug 02, 2015 - 09:51 PM GMTBy: Tony_Caldaro

 The market started the week at SPX 2080. After a gap down opening on Monday the market hit SPX 2064. It then doubled bottomed and hit SPX 2111 by Wednesday. After a gap down opening Thursday to SPX 2095, the market then rallied to close out the week at 2104. For the week the SPX/DOW were +0.95%, the NDX/NAZ were +0.75%, and the DJ World index was +0.70%. Economic reports for the week were generally negative. On the uptick: durable goods orders, Q2 GDP and the Chicago PMI. On the downtick: consumer confidence/sentiment, pending homes sales, the WLEI, plus weekly jobless claims rose. Next week will be highlighted by monthly Payrolls, ISM and the PCE.
LONG TERM: bull market
Another month has come and gone and the market is still in a trading range. From the first few days in February through Friday’s close, nearly six months, the market has been in a 95 point (4+%) trading range (2040-2135). The market has had two declines into the SPX 2040’s (March and July), and four rallies that have failed at the OEW 2131 pivot (April, May, June, and July). The first trading day in the month of August starts Monday.
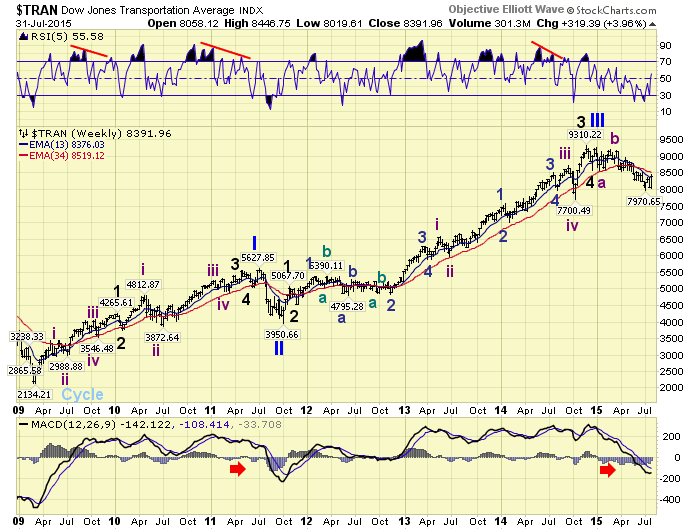
While this sideways consolidation/distribution has unfolded there has been some technical damage in some fairly important indices. The Transports, for example, look like they have been in Primary IV since late 2014. Observe the steady decline of three waves into the recent low, and the drop of the MACD into negative territory just like Primary II.
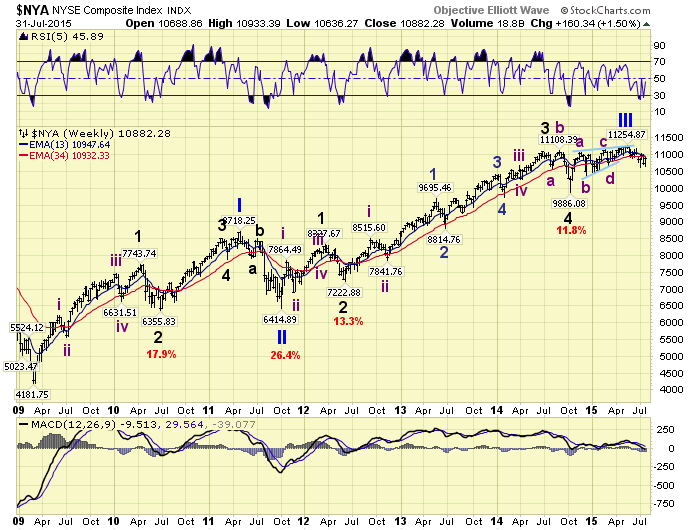
The NYSE composite has not had as much of a drop, but its MACD has just turned negative following what appears to be an ending diagonal triangle Major wave 5 to complete its Primary wave III.
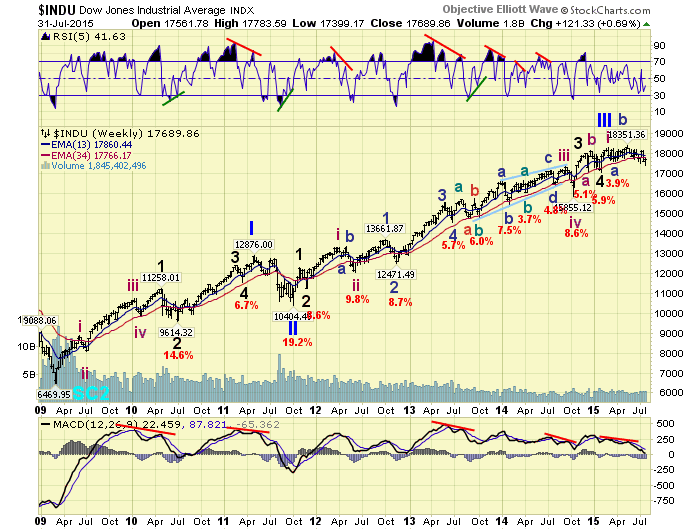
The DOW may have ended its Primary III early this year, but has stayed afloat due to the relative strength in the NDX/NAZ/SPX. Notice its MACD is getting close to turning negative too. It does appear the general market is giving some hints, while the popular SPX/NDX/NAX remain close to the all time highs.
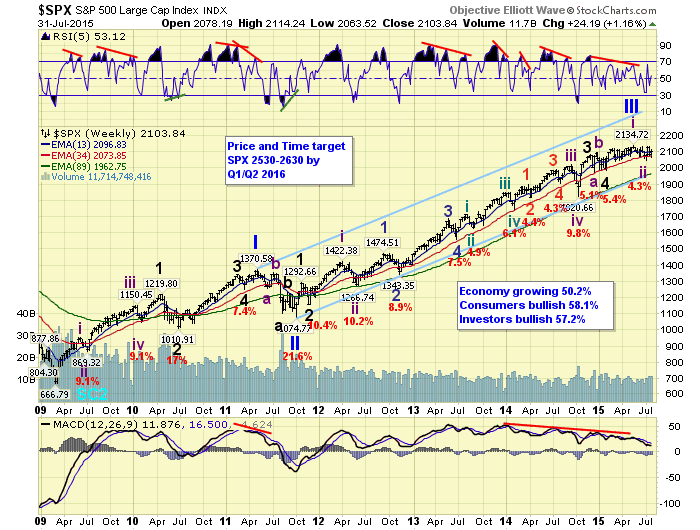
While we await the outcome of this lengthy trading range, the count on the SPX chart is offering two possibilities. First, Primary III ended in May with an ending diagonal triangle, just like the NYSE, and only the recent strength in the NDX/NAZ has been keeping Primary IV from kicking in to the downside. Second, the trading range is only an upper level consolidation and Major wave 5 will eventually extend into five Intermediate waves.
Whichever count does win out in the end it does not mean the end of the bull market. If the market is already in Primary IV, it will still make all time new highs after it completes. If Major wave 5 is going to extend Primary III will likely continue into 2016. Then after a Primary IV correction, Primary V will still take the market to new highs. Either way the bull market is not over. Currently we give both counts an even 50/50 probability with a clearing of the 2131 pivot range a positive, and a breakdown below SPX 2044 a negative.
MEDIUM TERM: uptrend remains above SPX 2100
After the irregular flat (December – February) Major wave 4 the market rallied strongly to SPX 2120. Then the DOW started to weaken, but the NDX/NAZ continued to work their way higher. As a result the SPX uptrend, which lasted from early-February to mid-May, took the form of a five wave (a-b-c-d-e) diagonal triangle. This pattern could be a leading or ending diagonal depending upon whether or not one was bullish or bearish. With the ECB’s EQE underway, and the Fibonacci years pattern, we remained bullish.
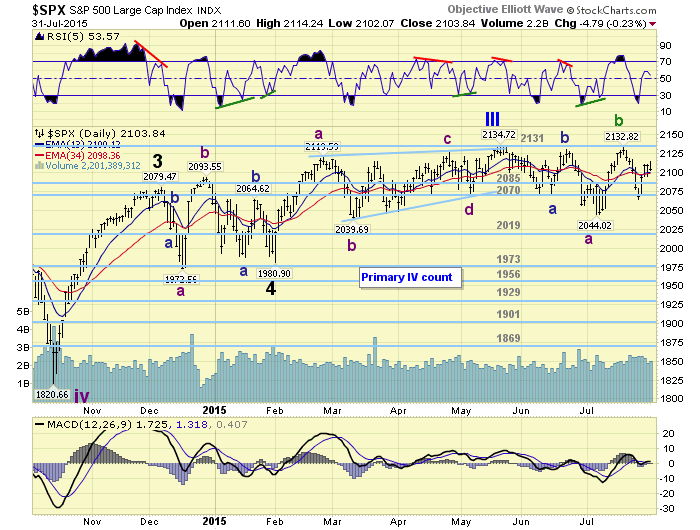
The downtrend that followed did not look like the typical selloff after a diagonal triangle, which is usually quite steep. It was a somewhat complex a-b-c into early-July, which retraced nearly exactly 61.8% of the previous uptrend. Up until that point everything looked quite normal for the bullish leading diagonal scenario. However, the uptrend that followed into mid-July began to look corrective. It should have looked impulsive, especially since we were expecting an Intermediate wave iii breakout of the trading range.
After the uptrend came within two points of the all time high, while the NDX/NAZ were making all time highs, it started to pullback. Meanwhile the DOW was more than 2% from its all time highs, and didn’t even confirm an uptrend when it started to pullback. As the pullback progressed in the SPX the entire uptrend started to look choppy, and the DOW actually made lower lows suggesting its downtrend from mid-May was still underway. This activity suggested the uptrend in the SPX/NDX/NAZ could be a B wave. As a result we had to give the bearish ending diagonal triangle scenario a higher probability. Medium term support is at the 2085 and 2070 pivots, with resistance at the 2131 and 2198 pivots.
SHORT TERM
After the downtrend low at SPX 2045 we counted several wave reversals during the rally to 2133. However, we could only quantify three waves: 2074-2051-2133. We were expecting five waves before a decent pullback. The pullback that followed, down to SPX 2064, was also three waves: 2110-2119-2064. This somewhat confirmed that the uptrend rally was again corrective. This week the market made a double bottom low at SPX 2064 on Monday, with a positive short term divergence. And, it rallied into Friday, hitting SPX 2114. Even this week’s rally is beginning to look like three waves: 2111-2095-2114.
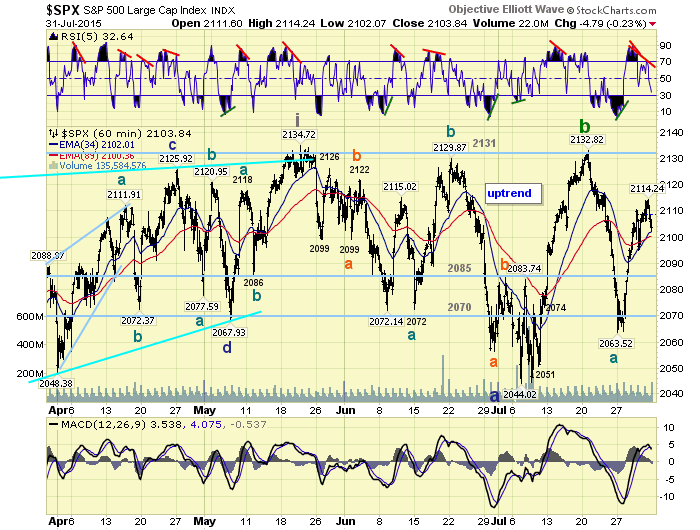
The bullish scenario, would suggest a three wave Intermediate wave ii is still underway. The recent downtrend low at SPX 2044/45 was Minor a, and the current uptrend high at SPX 2133 Minor b, with Minor c currently underway. The bearish scenario, would suggest the recent downtrend low was Intermediate a, the uptrend high Intermediate b, and Intermediate c of Major A is currently underway. Either way, we would expect the market to at least retest the SPX 2040’s before making substantial all time new highs. Should the market clear the OEW 2131 pivot range it could move a lot higher. Should the market drop well below SPX 2040 it could move a lot lower. Short term support is at the 2085 and 2070 pivots, with resistance at SPX 2114 and the 2131 pivot. Short term momentum ended the week with a negative divergence.
FOREIGN MARKETS
Asian markets were mostly lower on the week for a net loss of 2.0%.
European markets were mostly higher gained 0.3%.
The Commodity equity group were also mostly higher and gained 1.8%.
The DJ World index is still in a downtrend, but gained 0.7% on the week.
COMMODITIES
Bonds confirmed an uptrend and gained 0.5% on the week.
Crude continues to downtrend and lost 1.8%.
Gold is also in a downtrend and lost 0.3%.
The USD is still in an uptrend and gained 0.1%.
NEXT WEEK
Monday: Personal income/spending, the PCE, and Auto sales at 8:30; ISM manufacturing and Construction spending at 10am; then a speech from FED governor Powell at 11am. Tuesday: Factory orders. Wednesday: the ADP, the Trade deficit, and ISM services. Thursday: weekly Jobless claims. Friday: Payrolls, the Unemployment rate and Consumer credit. Best to your weekend and week!
CHARTS: http://stockcharts.com/public/1269446/tenpp
After about 40 years of investing in the markets one learns that the markets are constantly changing, not only in price, but in what drives the markets. In the 1960s, the Nifty Fifty were the leaders of the stock market. In the 1970s, stock selection using Technical Analysis was important, as the market stayed with a trading range for the entire decade. In the 1980s, the market finally broke out of it doldrums, as the DOW broke through 1100 in 1982, and launched the greatest bull market on record.
Sharing is an important aspect of a life. Over 100 people have joined our group, from all walks of life, covering twenty three countries across the globe. It's been the most fun I have ever had in the market. Sharing uncommon knowledge, with investors. In hope of aiding them in finding their financial independence.
Copyright © 2015 Tony Caldaro - All Rights Reserved Disclaimer: The above is a matter of opinion provided for general information purposes only and is not intended as investment advice. Information and analysis above are derived from sources and utilising methods believed to be reliable, but we cannot accept responsibility for any losses you may incur as a result of this analysis. Individuals should consult with their personal financial advisors.
Tony Caldaro Archive |
© 2005-2022 http://www.MarketOracle.co.uk - The Market Oracle is a FREE Daily Financial Markets Analysis & Forecasting online publication.