


Top 3 Technical Trading Tools Part 1: Japanese Candlesticks
InvestorEducation / Learn to Trade Aug 13, 2015 - 12:56 PM GMTBy: EWI

 Elliott Wave International senior analyst shows you how to identify quality trade setups
"I always will be an Elliottician, but other technical tools have merit and are indeed worthwhile: they allow me to build a case, build a more confident reason for making a forecast and for taking a trade; making a trading decision." -Jeffrey Kennedy
I recently asked Elliott Wave International analyst Jeffrey Kennedy to name his 3 favorite technical tools (besides the Wave Principle). He told me that Japanese candlesticks, RSI, and MACD Indicators are currently his top methods to support trade setups.
In this 3-part series, we will share examples of how to use these 3 tools to "build a case" in the markets you trade. These practical lessons allow you to preview how Jeffrey applies techniques with proven reliability to support his analysis.
We begin this first lesson with a basic candlestick-style price chart.
This is excerpted from Jeffrey Kennedy's teachings. If you are interested in learning how to become a more successful technical trader, get more lessons like this in Jeffrey Kennedy's FREE report, 6 Lessons to Help You Spot Trading Opportunities in Any Market >>
You may be familiar with an Open-High-Low-Close (OHLC) chart: comprised of vertical lines with small horizontal lines on each side. The top of each vertical line is the high and the bottom is the low. The small horizontal lines on either side represent the open and close for that period.
Here's an example of a Japanese Candlestick chart:
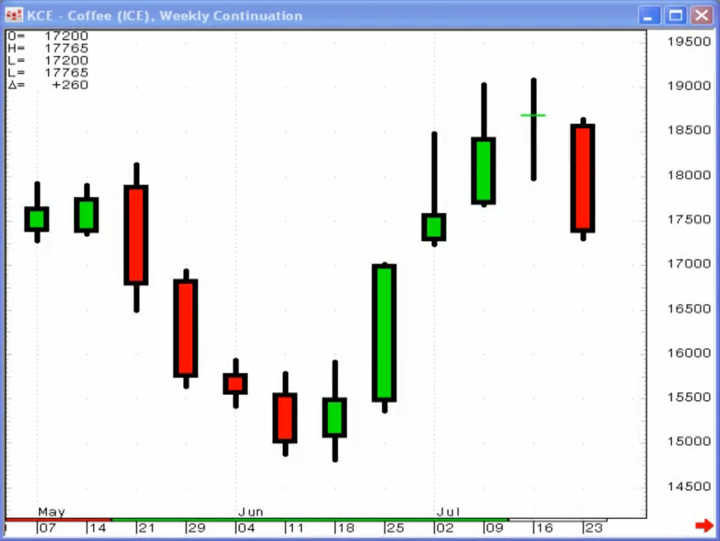
Japanese candlestick charts employ the same data that OHLC price charts do except that the data is expressed differently. The real body is the range between the open and close, and appears as a small block. Shadows are the lines that extend upward and downward from this block, and represent the highs and lows.
Next, take a look at the chart below.
Two bearish candlestick reversal patterns that Jeffrey finds highly reliable are the Evening Star and the Bearish Engulfing Patterns. This weekly continuation chart for the Canadian Dollar combines a 20-period moving average to show that the trend is down -- allowing you to focus on bearish reversal candlestick patterns to spot trading opportunities.
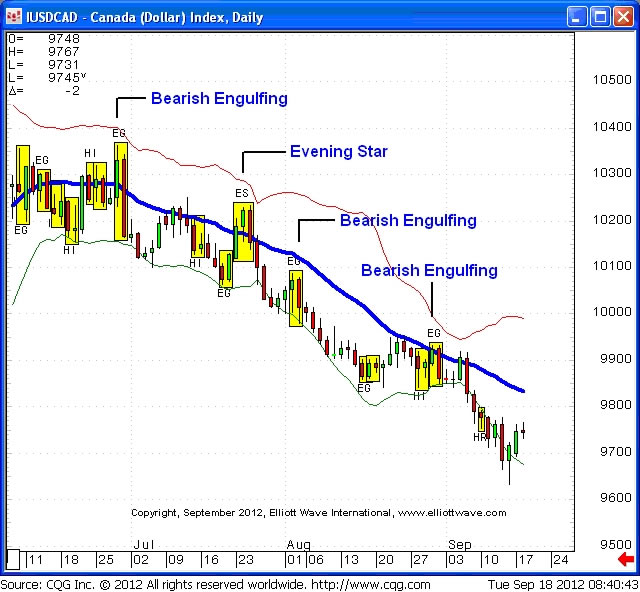
Jeffrey notes that "combining these reversal patterns with moving averages makes them even more dynamic because they focus your attention in the direction of the larger trend."
**********
Japanese Candlesticks begin our spotlight on Kennedy's top 3 ancillary tools for trading with the Wave Principle. Over the next two weeks, we'll share parts two and three-- how Kennedy uses RSI and MACD Indicators to support his Elliott wave interpretation.
|
Free Club EWI Report 6 Lessons to Help You Find Trading Opportunities in Any MarketIf you are interested in learning how to become a more successful technical trader, get more lessons like this in Jeffrey Kennedy's free report, 6 Lessons to Help You Spot Trading Opportunities in Any Market. This free report includes 6 different lessons that you can apply to your charts immediately. Learn how to spot and act on trading opportunities in the markets you follow, starting now! Log in to access this free report now >> Need a login? Complete your free Club EWI profile now and get immediate access >> |

This article was syndicated by Elliott Wave International and was originally published under the headline Top 3 Technical Tools Part 1: Japanese Candlesticks. EWI is the world's largest market forecasting firm. Its staff of full-time analysts led by Chartered Market Technician Robert Prechter provides 24-hour-a-day market analysis to institutional and private investors around the world.
About the Publisher, Elliott Wave International
Founded in 1979 by Robert R. Prechter Jr., Elliott Wave International (EWI) is the world's largest market forecasting firm. Its staff of full-time analysts provides 24-hour-a-day market analysis to institutional and private investors around the world.
© 2005-2022 http://www.MarketOracle.co.uk - The Market Oracle is a FREE Daily Financial Markets Analysis & Forecasting online publication.