


Not Enough Gold to Pay All Holders of Gold Obligations
Commodities / Gold and Silver 2015 Sep 29, 2015 - 02:23 PM GMTBy: Hubert_Moolman

 It is often reported that governments and central banks have for years leased or sold their gold to bullion banks; therefore, they are unlikely to possess the tons of gold, they are said to hold. Also, the bullion banks seem to be under enormous pressure recently. Just look at the recently reported spike in the gold coverage ratio on COMEX, with, there being over 200 ounces of paper gold claims for every ounce of deliverable gold (as reported on zerohedge.com)
This made me think of whether there is a pattern visible on the charts that could link the current physical gold shortage to the famous gold shortages of the 30s and 70s. During those famous gold shortages, there were gold promises/obligations in existence that would never be settled. They have still not been settled, and have been instrumental in pushing gold prices much higher.
Below, is a chart (from macrotrends.com) that shows the ratio of the gold price to the St. Louis Adjusted Monetary Base back to 1918. That is the gold price in US dollars divided by the St. Louis Adjusted Monetary Base in billions of US dollars. So, for example, currently the ratio is at 0.28 [$1 125 (current gold price)/ $4 019 (which represents 4 019 billions of US dollars)].
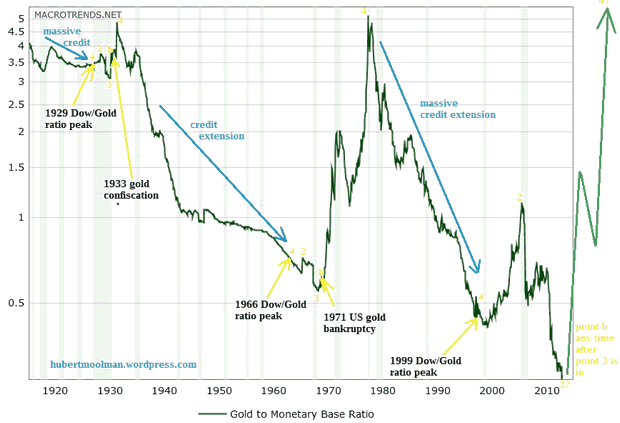
Historically when this ratio was going down, then there are more claims on gold than what was actually being held by the Federal Reserve or US Treasury (for more on this ratio). At some point after the ratio is going down there would be pressure to fulfil gold obligations due to the shortage of physical gold compared to claims on gold. This pressure often comes after a significant change in conditions such as after a stock market peak. Just like financial fraud is often discovered when business is slow, as was possibly the case with Bernie Madoff.
On the chart, I have indicated the three yellow points (a) where the Dow/Gold ratio peaked. These all came after a period of credit extension, which effectively put downward pressure on the gold price. Points 2 were placed just to show the similarities of the three patterns.
After the peak in the Dow/Gold ratio and point 2, the Gold/Monetary Base chart made a bottom at point 3 on each pattern. It is at these points that the monetary base could not expand relatively faster than the gold price increased. Today, this could mean that the point at which the game is up for those who are short gold.
I do not know if point 3 is in on the current pattern; however, given the fact that the bullion banks are under pressure as indicated in the spike in the gold coverage ratio at the COMEX, it might well be.
In 1933, after point 3 was in, the gold confiscation order was passed (point b). This came about due to the pressure to fulfill gold obligations. This was confirmed later by Roosevelt when he justified Gold Reserve Act 1934 by saying that, "Since there was not enough gold to pay all holders of gold obligations, . . . the federal government should expropriate and keep all of the gold"
Again in 1971, after the relevant point 3, due to being unable to cover all the foreign holdings of US dollars with the related amount of gold, the US suspended (really ended) the convertibility of the US dollar into gold, on 13 August 1971 (point b).
So, after point 3 is officially in on the current pattern, we could possibly expect a point b at which a major event in the gold or/and bond market could happen. When this event happen, it might be too late to add to your gold or silver position. It will also prove that gold and silver is still relevant as monetary assets.
For more of this kind of analysis on silver and gold, you are welcome to subscribe to my premium service. I have also recently completed a Long-term Silver Fractal Analysis Report .
Warm regards
Hubert
“And it shall come to pass, that whosoever shall call on the name of the Lord shall be saved”
http://hubertmoolman.wordpress.com/
You can email any comments to hubert@hgmandassociates.co.za
© 2015 Copyright Hubert Moolman - All Rights Reserved
Disclaimer: The above is a matter of opinion provided for general information purposes only and is not intended as investment advice. Information and analysis above are derived from sources and utilising methods believed to be reliable, but we cannot accept responsibility for any losses you may incur as a result of this analysis. Individuals should consult with their personal financial advisors.
© 2005-2022 http://www.MarketOracle.co.uk - The Market Oracle is a FREE Daily Financial Markets Analysis & Forecasting online publication.