


Stock Market Correction Still in Force
Stock-Markets / Stock Markets 2015 Oct 05, 2015 - 10:14 AM GMTBy: Andre_Gratian

 Current Position of the Market
SPX: Long-term trend - Bull Market?
Intermediate trend - SPX is in the midst of an intermediate correction (at least).
Analysis of the short-term trend is done on a daily basis with the help of hourly charts. It is an important adjunct to the analysis of daily and weekly charts which discusses the course of longer market trends.
CORRECTION STILL IN FORCE
Market Overview
"... if (when) the 1911 and 1903 levels give way, we could expect to test the former low of 1867 once again... (T)hat may produce only a temporary pause in the entire downtrend from 2135. There are lower projections, some of them potentially much lower. How the index handles the 1911/1903 and the 1867 support could give us some clues concerning whether or not we have started a bear market."
1867 is a major support level because it is the bottom of the channel which defines the primary trend of the SPX at this time. This will be discussed in the analysis section. There was a 50/50 chance that it would hold once again, and it did! That does not mean that the correction is over! Far from it. The degree of distribution which occurred after the October 2014 rally, has given us much lower counts which will take time to fill. Unless some radical changes take place in the market trend, this practically ensures that we have started a bear market or, at least, a lengthy intermediate correction. Whenever the channel line which is drawn from the October '04 low is broken, the primary trend will accelerate into a steeper formation.
By rallying from the level of the August low, the index has somewhat clarified its current structure. Last week's rally is evolving in a corrective wave and not an impulse, adding to the notion that 1867 should eventually be penetrated, perhaps soon. While some cycles have apparently made their lows, longer ones are still bottoming and should continue to pressure the market for some time to come.
Friday's rally may have reached its apex at 1950. This fills a P&F target taken from the small base created over the last few days.
Intermediate Indicators Survey
The weekly MACD declined slightly from - 32.77 to -33.12. The deceleration is better observed in the histogram which rose slightly last week.
The weekly cumulative A/D rose fractionally last week. NYSI is shown below.
The projection target of 1950 comes from the 3X P&F chart.
Chart Analysis
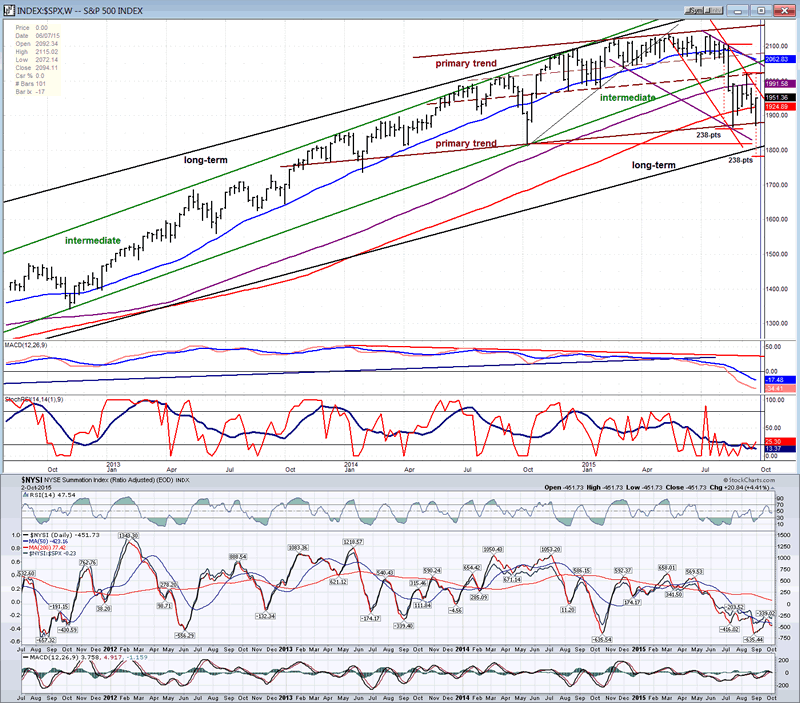
The Weekly SPX chart (courtesy of QCharts.com, as well as others below) is supplemented by the weekly McClellan Summation Index (courtesy of StockCharts.com) which is posted directly below it. This permits us to obtain a good perspective of the present intermediate technical position of the index. I have drawn some of the main channels which are currently in play.
Let's start our analysis with a look at the long-term trend. The green channel, which delineates the trend since October 2011, has been decisively broken. The bull market channel which goes back to March 2009 is still intact, but may soon be tested. For the aficionados of the EWS, the break of the intermediate channel potentially represents the end of primary wave III and the beginning of primary wave IV. Their dilemma is to decide if the latter ended last week and if wave V has started. This is doubtful since the new uptrend (so far) appears to be corrective. Initial confirmation that we are in a bear market will occur when prices come out of the long term channel.
Possibly the most important channel, right now, is the one which defines the primary trend of the market. It was created with a trend line drawn across the last two tops and a parallel initiated at the October '14 low. The bottom channel line draws its validity from having already connected four points over the past two years. That makes it a very important support level when tested; as it proved to be, last week. That channel implies that the primary trend is currently in an almost flat pattern which could turn out to be a larger replica of the one which formed above its (dashed) mid-channel line starting in December of last year. Until its lower trend line is broken, prices could continue to trade within that channel's range for months! If, however, we consider the current cyclic configuration, this is unlikely, and its title of "primary" trend could soon be relinquished to the purple channel, which could easily accommodate falling prices if that were to take place. The red channel is most likely defining the intermediate trend and could continue to outline declining prices as long as its upper line is not seriously violated.
If (when?) the primary support line is breached, and prices continue beyond the long-term trend line from 2009 -- which is not that far away from where prices are currently trading -- we will have an initial confirmation that we have started a bear market. As stated above, the amount of distribution which occurred at the top of the move strongly favors the bear case.
As you can see, a reliable analysis of the market trend can be made by observing the price action alone, without the help of fancy indicators and theories. Although some can be helpful if interpreted correctly, especially those which pertain to market breadth. As an example, the NYSI (below) began to warn of coming weakness long before prices broke. The same can be said of the declining MACD which began to show negative divergence as early as July 2004. Neither of these two oscillators is currently giving an indication that prices have made a significant bottom.
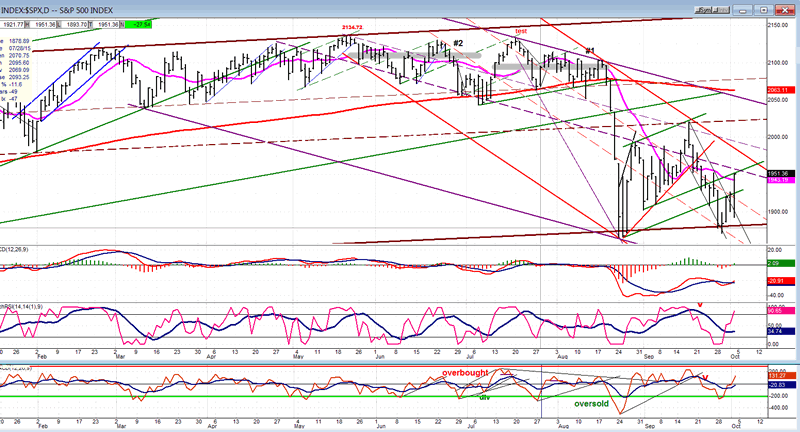
The Daily SPX shows more clearly how the channels are constructed and how the various parallels tend to turn the price around as they are reached. No adjustment of the trend line is necessary. One reason that the major lower channel line held both times is that, in both cases, the index was heavily oversold by the time it was touched. Another proof of the validity of the channels is that their mid-channel lines and other internal parallels drawn from key points provided support or resistance depending on the direction from which they were approached.
On Friday, the rally ended at the mid-channel line of the purple channel which, with the assistance of the green trend line and the 15-DMA, should arrest the move's momentum -- especially since it filled a P&F target and since the "c" wave of the a-b-c pattern happens to be the exact same length as the "a" wave.
The indicators are straight up, showing plenty of momentum and no divergence. After a short consolidation, an attempt at extending the move is likely, but not certain. There is a 13-day and 13-week cycle bottoming over the next 5 days which could interfere with an attempt at pushing higher.
This is mostly trying to make things fit, but you never know! I think that there is still a reasonable chance that we could still have a measured move down to about 1785 for the second leg down from 2020. This may just be coincidence but, if we went straight down from 1950 and continued below the major channel line by the same distance that we went up to 1950, it would take us exactly to the level needed to complete the measured move.
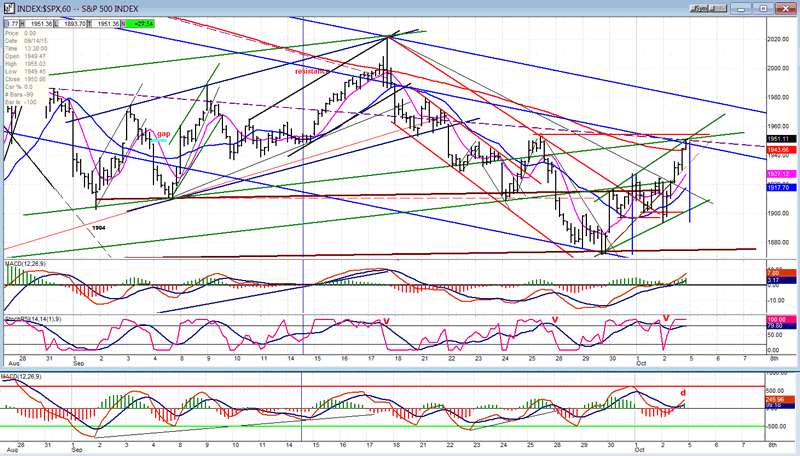
On the Hourly chart, the resistance from the various trend lines is more noticeable. In addition, the move has slightly surpassed the 200-hr MA which will have to be overcome conclusively to extend the move. The peak of the former short-term top will also have to be exceeded. That's a lot of resistance for a rally which has met its P&F objective and has made a measured move (blue lines).
The negative divergence is most pronounced in the A/D oscillator (lowest), but also apparent in the shorter histogram bars of the price MACD.
All the factors alluded to in the analysis of the previous charts points to 1950 being the short-term top of a corrective pattern, which portends a least a temporary pause in the advance...and perhaps something more.
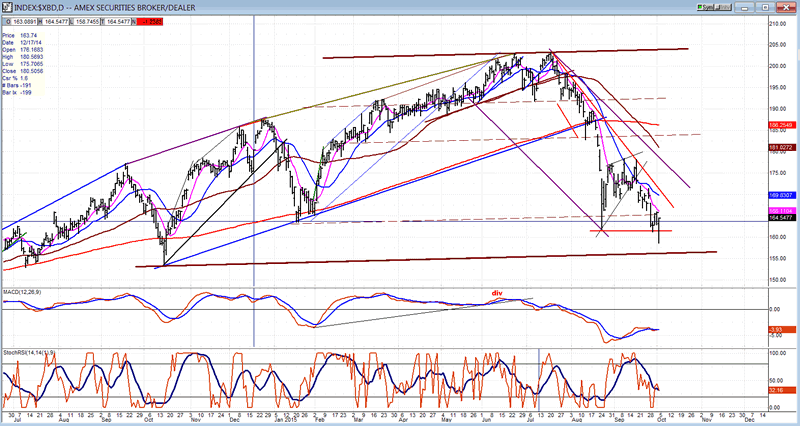
XBD (American Securities Broker/Dealer)
Last week, I showed the Global Dow which is an important index to compare with the SPX. This week, I want to return to the XBD, which is another important leading index.
As you can see, XBD, which had been stronger than SPX, did warn of an impending decline by rapidly losing ground while SPX was still hanging on inside its trading range. This was largely ignored because XBD had made new highs while SPX was trading sideways. I have also connected the last two tops of XBD and drawn parallels at previous lows. It seems to create valid support lines. This index has not quite reached the parallel drawn from the October low, but last week, it did make a new low while SPX did not. We probably should not draw too much of a conclusion from this fact alone, but we'll see how it continues to perform relative to the market index, especially if it is the first to break below the October line.
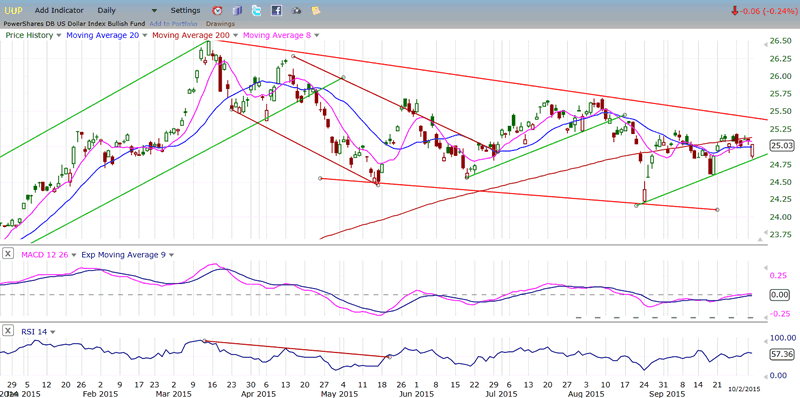
UUP (dollar ETF)
UUP reacted negatively to a weakening job report on Friday, and that puts it in danger of reversing its attempt at overcoming the 200-DMA and of continuing its consolidation instead. Let's see what it does from here on, but note that this action has already had an effect on the next index.
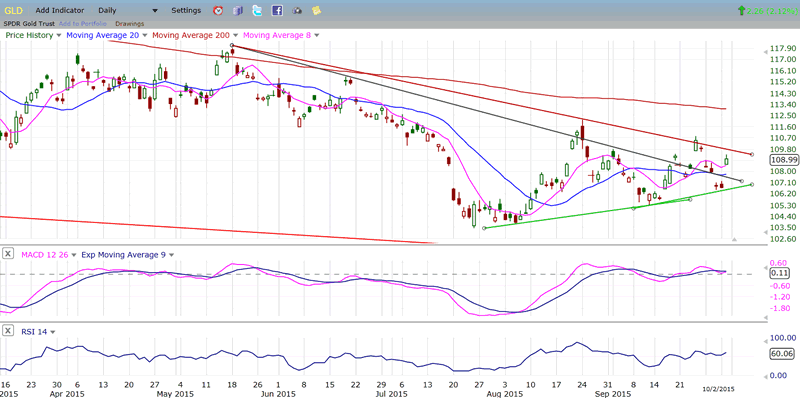
GLD (Gold trust)
GLD reacted positively to the dollar's show of weakness and, if UUP continues to pull back, this should help GLD attempt to break out of its current consolidation pattern. Its chart shows that if it can trade above 112, it could push up to 116/19 right away.
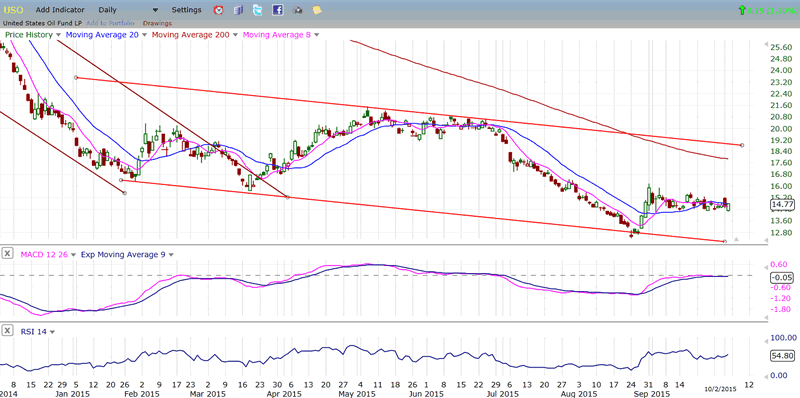
USO (United States Oil Fund)
USO could also benefit from a weaker dollar, although it did not seem to be affected positively on Friday. In the case of oil, a weakening economy means less energy consumption. Let's see what follows.
Summary
Last week, SPX broke the two minor support levels mentioned, but was stopped at the bottom of the primary channel, and bounced. This bounce also had to do with the completion of an apparent 5-wave pattern from 2020. At this point, the bounce structure is corrective and, for reasons cited in the analysis section, is likely to have ended its move at 1950. What comes next should be instructive concerning the market's immediate intention. Will the minor cycles bottoming in the next few days, reinforced by larger cycles and seasonal patterns be enough to force a break below the previous near-term lows, or will more preparation be needed first, including the possibility of trading above 1950?
Andre
FREE TRIAL SUBSCRIPTION
If precision in market timing for all time framesis something that you find important, you should
Consider taking a trial subscription to my service. It is free, and you will have four weeks to evaluate its worth. It embodies many years of research with the eventual goal of understanding as perfectly as possible how the market functions. I believe that I have achieved this goal.
For a FREE 4-week trial, Send an email to: info@marketurningpoints.com
For further subscription options, payment plans, and for important general information, I encourage
you to visit my website at www.marketurningpoints.com. It contains summaries of my background, my
investment and trading strategies, and my unique method of intra-day communication with
subscribers. I have also started an archive of former newsletters so that you can not only evaluate past performance, but also be aware of the increasing accuracy of forecasts.
Disclaimer - The above comments about the financial markets are based purely on what I consider to be sound technical analysis principles uncompromised by fundamental considerations. They represent my own opinion and are not meant to be construed as trading or investment advice, but are offered as an analytical point of view which might be of interest to those who follow stock market cycles and technical analysis.
Andre Gratian Archive |
© 2005-2022 http://www.MarketOracle.co.uk - The Market Oracle is a FREE Daily Financial Markets Analysis & Forecasting online publication.