


Political Week Presurres US Stock Market
Stock-Markets / Stock Market 2017 Mar 25, 2017 - 05:15 PM GMTBy: Tony_Caldaro

 The market started the week at SPX 2378. After a pullback to SPX 2370 on Monday, the market gapped up to 2382 on Tuesday. But that was immediately sold off and the market hit SPX 2336 by Wednesday. Thursday the market rebounded to SPX 2359, then on Friday the market retested 2336 and ended the week at 2344. For the week the SPX/DOW lost 1.45%, and the NDX/NAZ lost 1.00%. Economic reports were mixed on the week. On the downtick: existing homes sales, the WLEI, plus weekly jobless claims rose. On the uptick: new home sales, durable goods orders, and the Q1 GDP estimate. Next week’s highlights: Q4 GDP, the Chicago PMI, the PCE and a speech from FED Chair Yellen. Best to your weekend and week!
LONG TERM: uptrend
This week the market experienced its worse weekly decline since October: -1.4%. Considering the market has rallied 15.2% since November it is a relatively small decline. From the early-March SPX 2401 all-time high the market had declined 2.7% at this week’s SPX 2336 low. This is the largest decline, in points and percentage, since the current uptrend began in early-November. With this in mind, it is possible that a correction could be underway. While our internal uptrend wave count does not support it, a break of the OEW 2321 pivot range (2314-2328) would likely suggest that scenario.
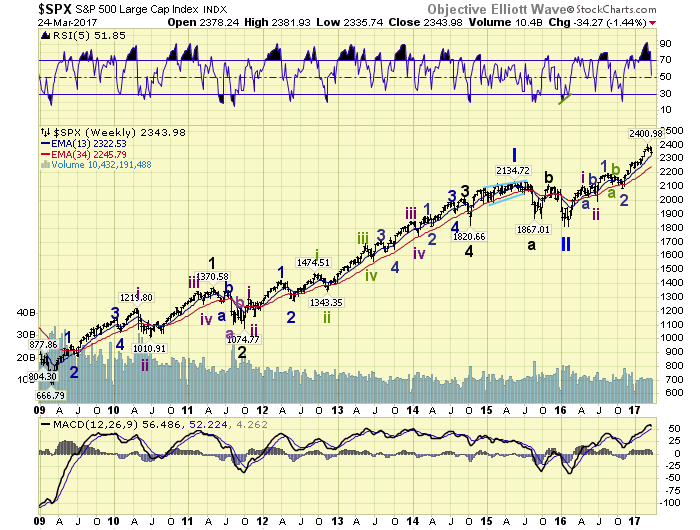
Whether the market experiences a correction, or not, the long term count remains unaffected. A Super cycle wave 2 low occurred in 2009 at SPX 667. Cycle wave [1] of Super cycle wave 3 has been underway since then. Cycle wave [1] should consist of five Primary waves. Primary wave I ended in 2015 at SPX 2135, and Primary wave II ended in 2016 at SPX 1811, and Primary wave III has been underway since then. Primary III should consist of five Major waves. A Major wave 1 of Primary III bull market has been underway since the February 2016 Primary II low at SPX 1811.
MEDIUM TERM: uptrend
Major wave 1 is dividing into five Intermediate waves. Intermediate wave i ended in April at SPX 2111, Int. wave ii ended in June at SPX 1992, and Int. wave iii has been underway since then. Intermediate wave iii is dividing into five Minor waves. Minor wave 1 ended in August at SPX 2194, Minor wave 2 ended in November at SPX 2084, and Minor wave 3 has already reached SPX 2401 during its current uptrend.
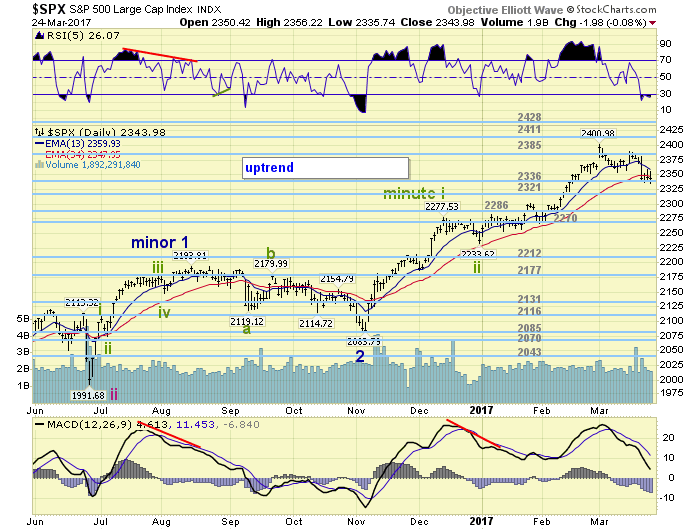
The Minor 3 uptrend has lasted longer, 4 months v 2 months, than either of the first two uptrends. And had travelled more points, 317 v 301 and 202, than either of the previous uptrends. This is typical for a third wave. Recently it also hit the most overbought weekly RSI reading since the year 2004. While the market has been under pressure this entire month, we are sticking with our short term count for this uptrend. Medium term support remains at the 2336 and 2321 pivots, with resistance at the 2385 and 2411 pivots.
SHORT TERM
Our short term count suggests the SPX is currently in a Nano iv pullback, of Micro 3, of Minute iii. Our short term count for the DOW suggests the market is currently in a Micro 4 pullback of Minute iii. Considering the length and depth of the pullback we tend to prefer the DOW count. When this pullback concludes, if it hasn’t already, we expect a rally to new highs to complete Minute wave iii. Then after another pullback for Minute iv, a Minute v rally to complete the entire uptrend. Not much wiggle room on the downside left. If this uptrend is going to resume, as expected, it will have to occur next week.
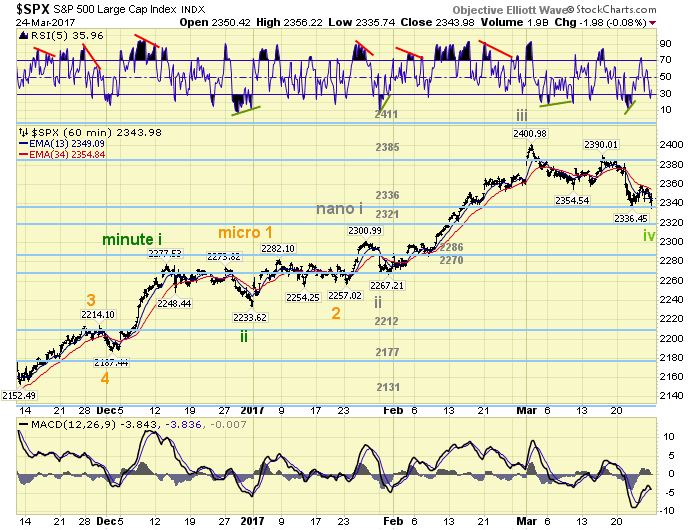
Short term support is at the 2336 and 2321 pivots, with resistance in the mid-2350’s and the 2385 pivot. Short term momentum ended the week oversold. Best to your trading!
FOREIGN MARKETS
The Asian markets were mostly lower on the week and lost 0.5%.
European markets were also mostly lower and lost 0.3%.
The DJ World index lost 0.8%, and the NYSE lost 1.3%.
COMMODITIES
Bonds remain in a downtrend and lost 0.3%.
Crude is also in a downtrend and lost 2.7%.
Gold appears to be in an uptrend and gained 1.5%.
The USD is in a downtrend and lost 0.5%.
NEXT WEEK
Tuesday: a speech from FED chair Yellen, the Case-Shiller index and consumer confidence. Wednesday: pending home sales. Thursday: Q4 GDP final (est. 2.0%) and weekly jobless claims. Friday: personal income/spending, the PCE, the Chicago PMI and consumer sentiment. Best to your weekend and week!
CHARTS: http://stockcharts.com/public/1269446/tenpp
After about 40 years of investing in the markets one learns that the markets are constantly changing, not only in price, but in what drives the markets. In the 1960s, the Nifty Fifty were the leaders of the stock market. In the 1970s, stock selection using Technical Analysis was important, as the market stayed with a trading range for the entire decade. In the 1980s, the market finally broke out of it doldrums, as the DOW broke through 1100 in 1982, and launched the greatest bull market on record.
Sharing is an important aspect of a life. Over 100 people have joined our group, from all walks of life, covering twenty three countries across the globe. It's been the most fun I have ever had in the market. Sharing uncommon knowledge, with investors. In hope of aiding them in finding their financial independence.
Copyright © 2017 Tony Caldaro - All Rights Reserved Disclaimer: The above is a matter of opinion provided for general information purposes only and is not intended as investment advice. Information and analysis above are derived from sources and utilising methods believed to be reliable, but we cannot accept responsibility for any losses you may incur as a result of this analysis. Individuals should consult with their personal financial advisors.
Tony Caldaro Archive |
© 2005-2022 http://www.MarketOracle.co.uk - The Market Oracle is a FREE Daily Financial Markets Analysis & Forecasting online publication.