The Stock Market Will Tank Hard
Stock-Markets / Stock Market 2017 May 24, 2017 - 11:16 AM GMTBy: The_Gold_Report
 The script for 2017-2018: Melt Up, then Global Meltdown, says Lior Gantz, editor of Wealth Research Group, who sees industrial metals, specifically silver and zinc, leading a commodities charge, while broad indices take a nose dive.
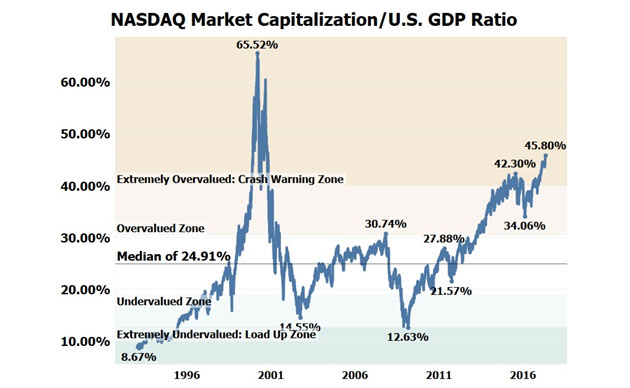
The market cap of the NASDAQ has reached a new all-time high of $8.705 trillion recently, which is equal to 45.8% of U.S. GDP. The long-term median NASDAQ market cap/GDP ratio is only 24.91%.
The current NASDAQ market cap/GDP ratio of 45.8% is the highest since October 23, 2000. At that time, the NASDAQ was trading for 3,469 and over the following 11 months, the NASDAQ declined by 59% to 1,423.
Out of the last 6,162 trading days, going back to the beginning of 1993, the NASDAQ has only been more overvalued than today, with a market cap/GDP ratio exceeding its current level of 45.8%, on a total of just 201 trading days, or 3.26% of the time. This means the NASDAQ's valuation is currently at a percentile of 96.74%—it's extremely overvalued and in a crash warning zone.
I'm certainly not the only one that thinks the U.S. markets are headed towards a nose dive—Ray Dalio, the largest hedge fund manager in history, and Warren Buffett, the greatest investor ever, share this exact view. When it gets messy, these chaos hedges will be critical.
Wealth Research Group Doesn't See This Crash Yet, Though!
While I know markets are very expensive, last week's 2% decline, which caused immense trader fears, showed me that we're not in bubble mania yet. Investors don't believe the bull market yet, and they sell at any slight news of trouble. This means the "melt up"—a stock market bubble fueled by central banking intervention—is still the major theme in investors' minds.
The markets are hitting 52-week highs, and the one-year historical outlook is clear-cut: the market is headed higher from here, as contrarian and foolish as it sounds. Retail amateurs are still not convinced of buying stocks, therefore the market will get even more expensive so that they'll believe they're missing out, and then pros will let them have the leftovers before the market rolls over on them like a great Hawaiian wave.
The professionals are monitoring global markets at the moment and seeing opportunities in cheaper Europe and in strengthening China.
They're also looking at the Fed rate hike policies.
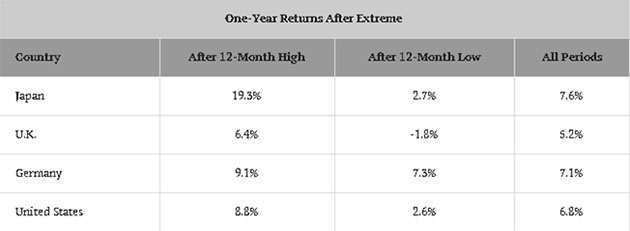
As you can see, after one-year highs, the markets perform well, so shorting them isn't smart at all.
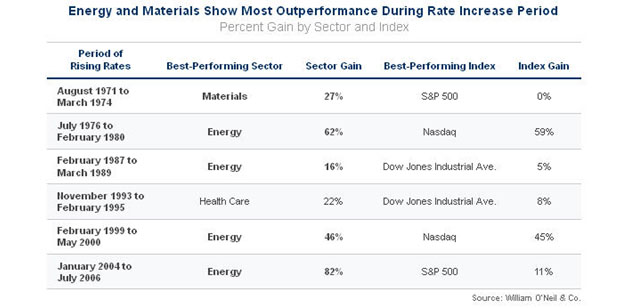
If the Fed raises rates again this June, traders would go all-in on commodities because China and India are taking care of their problems relatively successfully.
The 1971–1974 period, which is similar to today's environment, shows that materials (industrial metals) will be absolute outperformers.
Then, after this coming one-year "melt up" phenomenon ends with a blow-off on a global level, the meltdown begins. Professionals will be looking to position with non-correlated asset classes in advance, and gold stocks will see a tidal wave of money pouring in for the first time in years, right when their fundamentals couldn't be cleaner and healthier.
Investors already have a rear view mirror gauge of what the panic will look like, judging by last week's one-day plunge.
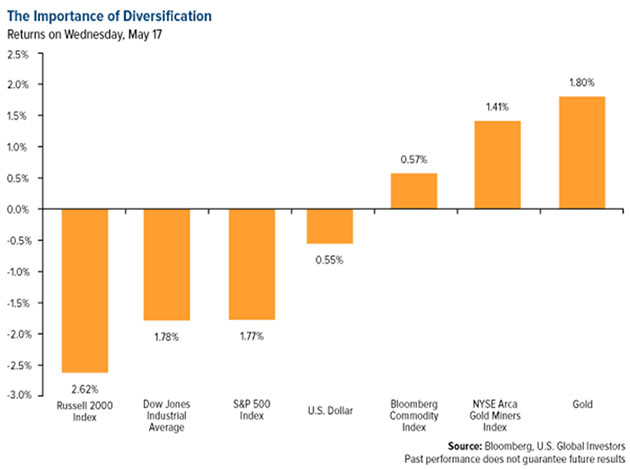
This chart shows what will dictate fund decisions in the meltdown, and the longer it melts up, the more violent the meltdown will be and the more gold stocks will be valued.
WRG's Script for 2017-2018—Melt Up, Then Global Meltdown:
Right now, the U.S. economy is functioning at its highest capacity. There is little room for improvement, so stocks are already fully priced and any further increase in prices makes the indices more risky of bursting their bubbles.
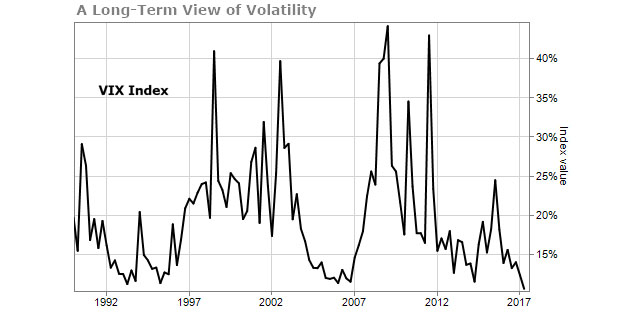
As the Feds keeps raising rates, materials—specifically industrial metals, like zinc and copper—will be big winners.
Then, the markets will reverse. There will be no warning sign and no idea when, but a panic will commence.
Five years after 12-month high periods, the markets have historically been lousy investments.
Funds and institutions will flock to the commodities sector, with an emphasis on precious metals, and a 1970s-style bull market will be in full throttle once the Fed lowers rates again!
Lior Gantz, an editor of Wealth Research Group, has built and runs numerous successful businesses and has traveled to over 30 countries in the past decade in pursuit of thrills and opportunities, gaining valuable knowledge and experience. He is an advocate of meticulous risk management, balanced asset allocation and proper position sizing. As a deep-value investor, Gantz loves researching businesses that are off the radar and completely unknown to most financial publications.
Want to read more Gold Report articles like this? Sign up for our free e-newsletter, and you'll learn when new articles have been published. To see a list of recent articles and interviews with industry analysts and commentators, visit our Streetwise Interviews page.
Disclosures:
1) Statements and opinions expressed are the opinions of Lior Gantz and not of Streetwise Reports or its officers. Lior Gantz is wholly responsible for the validity of the statements. Streetwise Reports was not involved in the content preparation. Lior Gantz was not paid by Streetwise Reports LLC for this article. Streetwise Reports was not paid by the author to publish or syndicate this article.
2) This article does not constitute investment advice. Each reader is encouraged to consult with his or her individual financial professional and any action a reader takes as a result of information presented here is his or her own responsibility. By opening this page, each reader accepts and agrees to Streetwise Reports' terms of use and full legal disclaimer. This article is not a solicitation for investment. Streetwise Reports does not render general or specific investment advice and the information on Streetwise Reports should not be considered a recommendation to buy or sell any security. Streetwise Reports does not endorse or recommend the business, products, services or securities of any company mentioned on Streetwise Reports.
Charts provided by Wealth Research Group
© 2005-2022 http://www.MarketOracle.co.uk - The Market Oracle is a FREE Daily Financial Markets Analysis & Forecasting online publication.


