


Financial Markets Outlook 2018
Stock-Markets / Financial Markets 2018 Jan 05, 2018 - 05:19 AM GMTBy: WMA

Williams Market Analytics write:
 Contents
I. Review 2017
II. Macroeconomic Outlook
III. Bonds & Yield
IV. Currency Markets
V. Commodities
VI. Equity Markets
VII. Final Thoughts for 2018
I. 2017 Market Review
2017 will go down as the year an investment strategy based on nothing more than sticking with winners shined brightest. Momentum traders and algorithms scored big. Cautious investors concerned amount mounting risk and buying at record highs were the losers.
In the equity space, the U.S. market was again the big winner. Markets, believing that the Federal Reserve has risk assets back-stopped, continued to pile into U.S. equities in the wake of the presidential election on hopes of getting fiscal stimulus on top of monetary stimulus. The S&P 500 finished the year up +19.4%; the Dow +25.1%; the Nasdaq-100 +31.5% and the Russell 2000 +13.4%. The biggest stocks did the best. For the first time in this bull market the cap-weighted S&P 500 beat the S&P 500 Equal-Weight Index. 2017 was also the year of complacency. Risk was overlooked and the VIX volatility index posted its lowest annual average reading of all time (10.95).
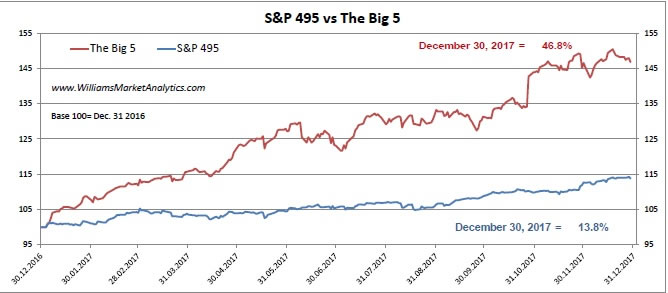
Two charts sum up the entire year for the equity markets. First, we’ve mentioned several times our S&P 495 Index, which excludes the Big 5 (Apple, Microsoft, Amazon, Google, and Facebook). Below is our chart for 2017. The Big 5 more than tripled the performance of the other 495 stocks, which had a less spectacular year than the full S&P 500.
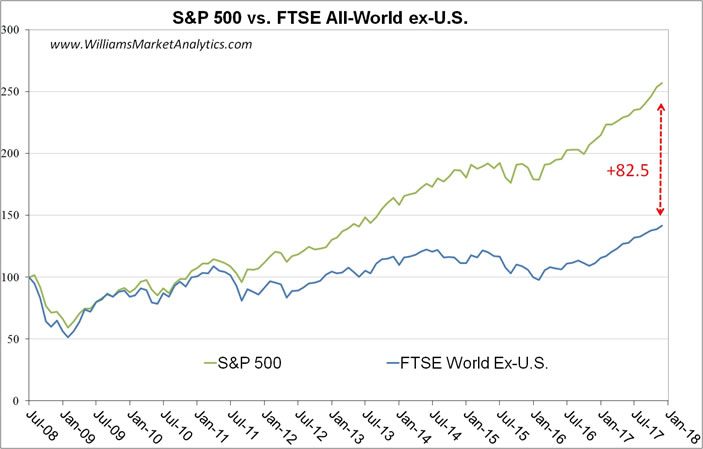
The second chart is that of the S&P 500 versus the FTSE All-World ex-U.S. Index. For most of the 9-year bull market, U.S. stocks have been the only game in town. In 2017, the FTSE All-World ex-U.S. hedged for currency returns underperformed once again the S&P 500 (+18.9% vs +19.4%). In fact, the S&P 500 has beaten the All-World ex-U.S. index each year since 2009! While we have been suspicious of one asset class consistently outperforming for so long, the market continues to confound traditional thinking.
Most of the rally in U.S. equities since 2009 can be attributed to Federal Reserve extraordinary monetary policy and the near-explicit back-stopping of the financial markets. The Fed did little to rock the boat in 2017. With the onset of its balance-sheet roll-off in October, the Federal Reserve officially took the first steps toward the reversal of quantitative easing measures (central bank asset purchases) enacted in response to the Global Financial Crisis nearly a decade ago. However in the 9th year of an economic expansion, Fed tightening at current interest rate levels remains purely symbolic and the central bank balance sheet is still four times larger than pre-crisis.
The bond market was relatively calm in 2017, as the U.S. 10-Year Treasury ended the year almost exactly where it started. Similarly, German and Japanese bonds traded horizontally in 2017. The heavy hands of central bankers continued to administer the yield markets in 2017. Low yields in the bond market relative to stock dividend yields fueled the flow of money out of bond markets and into stock markets.
On the currency front, the U.S. dollar was expected to strengthen in 2017 behind the Trump fiscal stimulus and infrastructure spending pledges as well as a relatively tighter Federal Reserve monetary policy. Instead the Dollar Index fell -10% as markets had already priced in these dollar-positive factors. Indeed, the dollar jumped over +6% after the U.S. election into year-end 2016, in retrospect marking a climax after the long dollar rally over 2014-2015.
Finally, commodities confirmed the cyclical bottoms made the previous year in 2016. West Texas Intermediate Crude Oil (WTI), after hitting a low of $26/barrel in early 2016, traded above $42/barrel throughout 2017, closing out the year at 2.5 year high above $60/barrel. Likewise, gold and silver, while remaining range-bound in 2017, managed to hold above the 2016 lows throughout the year.
II. Macroeconomic Outlook 2018
We expect economic growth in developed markets to remain moderate in 2018, while strong emerging-market growth should soften somewhat. In the U.S., the new fiscal policy stimulus ushered in by Donald Trump should boost GDP growth in the coming quarters. The combined tax cuts and spending increases are forecast to add around 0.7% to GDP growth in 2018 and another 0.2% in 2019. Donald Trump, no stranger to hyperbole, has predicted 6% annualized U.S. GDP growth. We find this very unlikely in the context of a historically unprecedented late-cycle fiscal stimulus package. Recall that the average length of post World War II economic expansion has been 58.4 months while the current expansion now stands at 96 months. Only the March 1991 to March 2001 (120 months) and the February 1961 to December 1969 (106 months) expansions have lasted longer. Some (such as Goldman Sachs) are placing a high probability that this expansion will become the longest in history (implying no recession before 2020). In an unusual period when history-making records are being set, we cannot bet against this expansion continuing another two years. But at the same time, we remind investors that the stock market cycle is not the same as the economic cycle. Typically, the stock market peaks nine months prior to the economic cycle peak and is one of the causative factors on an economic decline (hence the Fed’s current obsession with talking up the stock market). We would not be surprised if we see a historically long lead time between the stock market peak and the economic cycle peak this time around. That means the stock market could reach its peak any time in 2018, although we believe that the brunt of the next bear market is more likely in 2019.
We think that fiscal stimulus may actually become a drag on growth before 2020 as it could induce higher short-term and long-term interest rates. While Fed and government economists have been fretting about sub-par economic growth in the U.S., the risk for 2018 is an over-heating economy. We cannot remember an economic expansion that received both monetary and fiscal stimulus simultaneously so late in expansion. Recessions are a natural phase of the economic cycle. It seems highly unlikely that the current generation of policy makers have discovered the cure for the recessionary phase of the cycle by their simply over-stimulating the economy on a permanent basis. Putting off a recession in this manner will not eliminate future recessions but rather increase the severity of the next recession when it arrives.
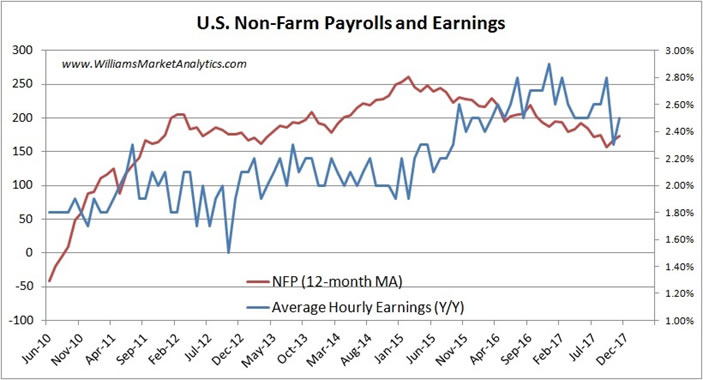
An already tight labor market will grow tighter in 2018 and stoke wage inflation. Non-Farm Payrolls peaked in 2015 on a rolling 12-month basis (red line, below), with monthly job creations slowing for the past two years. The U.S. economy produced, nevertheless, between 150k to 200k jobs per month in 2017 a healthy rate, as a decrease in job growth is not abnormal at this stage of the business cycle and should not be mistaken for an economic slowdown. Although the unemployment rate is an imprecise measure of the labor market (excluding “discouraged workers” among others), it is noteworthy that the U.S. unemployment rate fell to 4.1% in November – lower than the 4.4% seen in 2007 at the end of the previous economic expansion. As a result of the tightening labor market, we expect wage growth to pick up further in 2018. The blue line below shows that average hourly earnings rose at 2.5% in November 2017 and that wage inflation in 2017 was the strongest since the beginning of this economic expansion. One risk in 2018 is that a higher-than-expected bounce in wages may lead markets to reprice a more aggressive path of monetary policy normalization than currently expected.
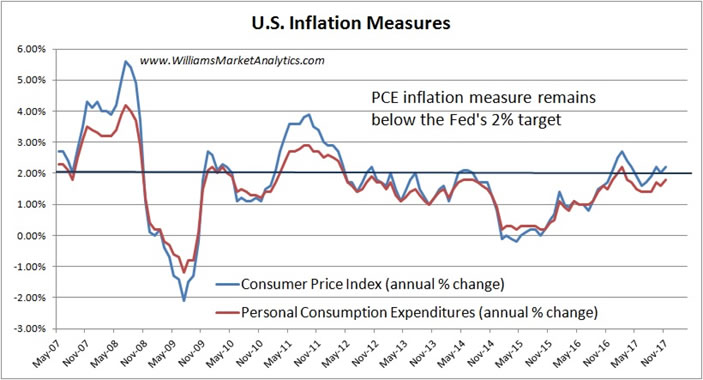
In 2018, we think that the influences recently bearing down on inflation will subside, increasing the probability of higher-than-trend inflation. Aside wage inflation pressures mentioned above, stronger economic growth and a potential nadir in commodity prices should combine to push inflation higher.
III. Bond & Yield Forecasts
Lower for longer has remained the mantra of the U.S., European, and Japanese central banks. Short rates remain exceptionally low for the eighth year of an economic expansion in the U.S. The Federal Reserve is still deeply concerned with the persistent undershoot of its 2% inflation goal. In our opinion, this concern is displaced as inflation has indeed materialized, just mostly in financial asset prices. Nonetheless, until the core PCE (personal consumption expenditures) measure of inflation picks up, we believe that the Fed will continue to allow the economy to grow at an even faster pace. Look for three modest 25 basis point rate hikes from the Fed in 2018, barring turbulence on financial markets that would cause the central bank to pause the planned tightening cycle.
In Europe, short rates will move even more slowly than at the Fed, as Mario Draghi and the European Central Bank (ECB) are knee-high in bond market manipulation. As it now stands, the ECB now owns over half of European corporate issues! Sluggish European growth, inflation well below the 2% target (core Euro zone inflation y/y stood at 0.9% in November), and highly indebted Euro zone nations (debt/GDP ratios in excess of 100% for Greece, Italy, Portugal, Spain, and Belgium) give more reasons to keep rates low than to entertain the possibility of normalization. The ECB is probably two years away from raising rates and is unlikely to taper the assets on its balance sheet until the next decade. The Bank of Japan is in a similar situation: no inflation, no growth, too much national debt. Once again, any attempt to normalize rates would tip the Japanese economy into recession and blow-up national finances. Japan (as well as the U.S. and much of Europe) cannot comfortably finance the interest payments on government debt at significantly higher interest rate levels. Policy makers know this and will not be bashful in manipulating interest rates lower.
In sum, central banksters have painted themselves into a corner by running extraordinary monetary policy well past the crisis period. Given the choice of (a) normalizing rates and almost certainly provoking the next recession or (b) sitting on their hands and waiting for the next debt crisis to be triggered by an exogenous event, our courageous central banksters have opted for the latter option. Just as the response to the financial crisis was unprecedented, the central banks’ path to normalization is not well-marked. The path ahead covers uncharted territory, so the chance of unexpected shocks to markets is high.
The long end of the yield curve, more sensitive to economic conditions and less directly manipulated by central banks, remained remarkably stable in 2017. U.S. 10-year rates oscillated 15 basis points on either side of 2.35%. German 10-year rates, although exhibiting wider swings, will finish 2017 around 0.35%, a few basis points from where rates began the year. Ten-year Japanese government bond yields similarly will finish 2017 at the same level they began the year: 0.05%.
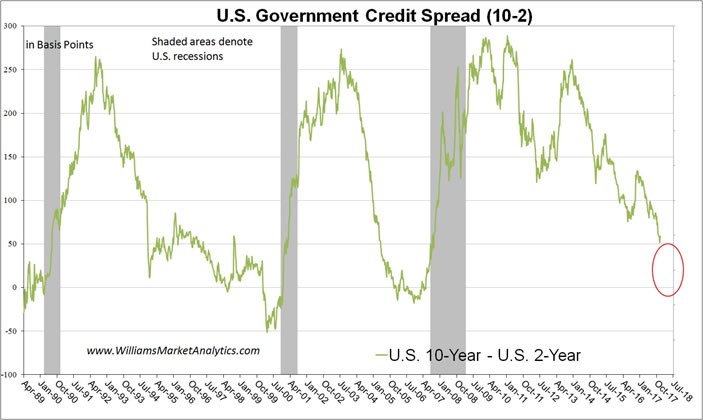
Even if central banks are dragging their collective feet in raising Fed funds rate, or the overnight discount rate, the bond market is not in agreement. U.S. 2-year rates, which began the year at 1.20%, are finishing 2017 at nearly 1.90%. German and Japan 2-year rates, however, have not moved significantly in 2017, mirroring the long-end of their respective yield curves. The following chart of the U.S. 10-2 yield curve is particularly interesting. The yield curve flattened significantly in 2017 (133 bp in January to 53 bp in December), finishing the year at the “flattest” level since 2008. Our chart shades the prior U.S. recession periods. Recall that the yield curve historically inverts prior to the economy dipping into a recession, as evidenced on our chart. The red circle shows the territory that the 10-2 curve must cover before inverting. If in 2018 the 2’s add to the 70 bp increase that occurred in 2017 while the long end remains impassive to the risk of a jump in U.S. deficit spending, it seems that long-term debt instruments could have a lower yield than short-term debt, which would then be a strong predictor of economic recession.
Forecasting rates in administered yield markets is more a bet on how long governments and central banks can repress market forces. Nevertheless, we see long rates in the U.S. moving higher as the bond market vigilantes beginning sniffing out a jump in deficit spending and the inflationary fall-out of Trump’s fiscal policy. Increasing spending (even if infrastructure spending is a net positive for the economy), while shrinking government receipts (from deficit-financed tax cuts), is not a recipe for sustainable government finances. While the Fed failed to create real-economy inflation through money-printing, the Federal government fiscal stimulus measures, we feel, should get the job done. If Trump gets both his tax cuts and spending bills through Congress, inflation should not be slow in materializing. In this scenario, nominal rates should begin backing up early in 2018. In addition to the inflation component built into long rates, we could reasonably expect the risk premium on Treasurys to rise. Deficit spending has never been favorably looked upon by bond investor…no more so than buying the paper of a highly indebted company. In this context, we expected the U.S. 10-year yield to at least hit 3.0% in 2018.
One question mark that remains concerning our scenario of higher interest rates in 2018 is the possibility of an equity market sell-off. While a 2.4% 10-year yield would seem to be an unattractive alternative to the stock market (where investors can earn at least a 2.4% dividend yield), should money flow out of stocks it is unlikely that this money will all go into cash. A safe-haven flow into Treasurys would pull yields down. In the event equity markets stall out, and assuming that the market is miss-estimating the risk of inflation, a significant holding in Treasury Inflation Protected Securities (TIPS) would seem to be the best bet.
Outside of the U.S., emerging market (EM) bonds remain among the best asset classes on a total return basis. Even as U.S. rates have risen, the spread between yields on EM sovereign bonds and U.S. Treasurys has narrowed. Credit ratings on EM bonds have trended to their lowest level since 2010. We saw sovereign downgrades in 2017 for China, South Africa, and Turkey. Indeed, the sustainability of many emerging countries’ high levels of debt, and the ability to refinance the debt as rates rise, remains a serious concern.
The New Year 2018 also brings unquantifiable political risks for EM sovereign debt. At least 18 national elections are scheduled, notably in the emerging market giants of South Africa and Indonesia. The risk of unexpected outcomes is high as reformist governments can slow economies far lower than expected.
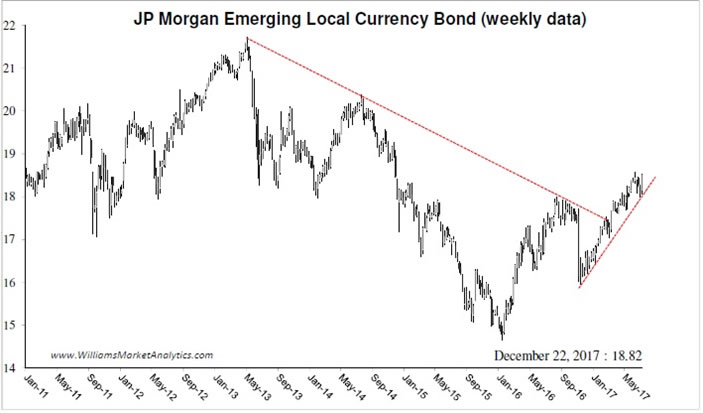
For investors seeking yield in EM bonds, we prefer local currency bonds, for the currency tailwinds (as mentioned in our Currency Outlook section below). The next chart is the JP Morgan Emerging Market Local Currency Bond Index. A return to 2013 levels would represent a +16% capital appreciation (in addition to the 5.3% annual coupon). This index is investable via the EMLC tracker. For investors looking to maintain exposure to risk assets, but not keen on crowding into U.S. equities, the local currency emerging bonds may offer nice, high-yielding diversification.
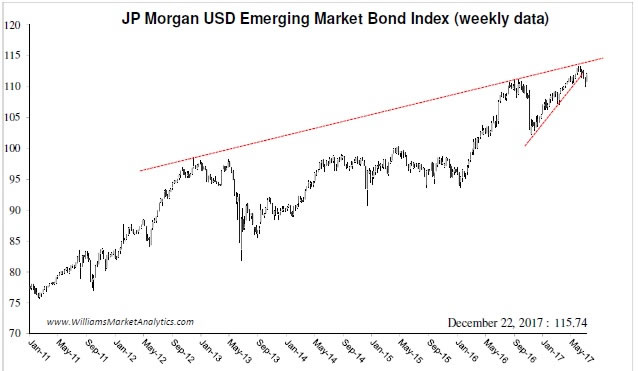
By comparison, hard currency (USD) emerging market bonds seem relatively less attractive, due to the relative strength of the dollar versus EM currencies over the past several years. The JP Morgan USD Emerging Market Bond Index (below) is just off all-time highs and will likely trade hand-in-hand with risk assets going forward. The tracker for this index is the EMB.
IV. Currency Market Outlook
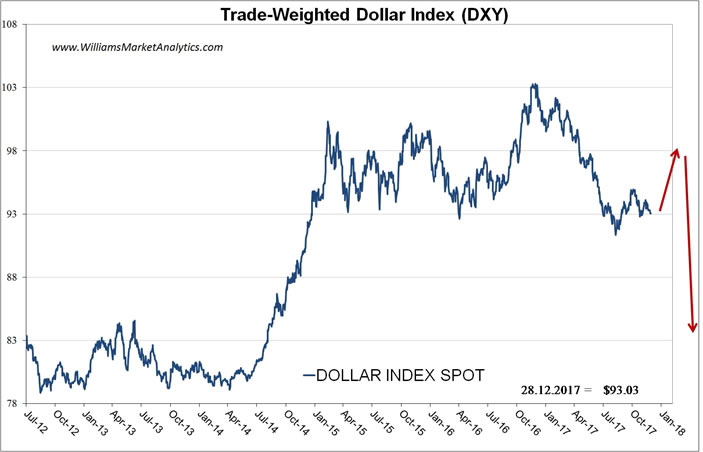
The U.S. Dollar Index’s 2017 slide halted in September as Washington turned its attention to fiscal reform. Recognizing a potential tidal wave of U.S. corporate cash from abroad (companies could bring back as much as $400 billion), investors suddenly decided that the dollar may still be attractive.
We cannot exclude more short-term momentum in favor of the dollar with the passage of the Republican tax package and the potential boost in Federal spending as Trump begins pushing infrastructure rebuilding. The end result of Trump’s programme should stimulate inflation and induce the Federal Reserve to raise rates at a faster pace. However, after a 6-year Dollar Index rally off of 2011 lows, any further dollar rally on the same Trump news could mark a climax and selling opportunity.
First, it is uncertain how much of the more than $1 trillion U.S. companies hold abroad will be converted back into USD. Moreover, while everyone knows that repatriation will create demand for dollars, we can only guess how much of the anticipated repatriation has already been priced into the dollar by the markets.
Second, more central banks overseas are unwinding nearly a decade of post-crisis simulative measures. As the European Central Bank (among others) begin normalizing rates, the dollar will become less appealing on a relative interest rate basis.
Third, the long-run impact of the Trump tax cuts will be a gaping budget deficit. While repatriation of funds will help, other countries are causing blow-back, including new taxes and penalties that cause companies to reconsider the 21% rate incentive.
Finally, a possible NAFTA failure will be a big factor too if US exports are trimmed to Canada and Mexico who may decide to make their purchases elsewhere. We are already seeing this impact on Boeing commercial and military planes with the Bombardier-Airbus deal and cut-backs of Canadian government purchases.
Bottom line: the dollar may be a little stronger in early 2018 but we expect the greenback to then fade as all the dollar-positive news gets priced in and the above headwinds take hold.
As for emerging market currencies versus the U.S. dollar, we remain constructive for the upcoming year. Below is a seven-year chart of our WMA Emerging Market Currency Index, composed of a basket of ten major emerging currencies versus the U.S. dollar. By our measure, EM currencies are still down -42% from the 2011 high (the index reached 190 prior to the Financial Crisis).
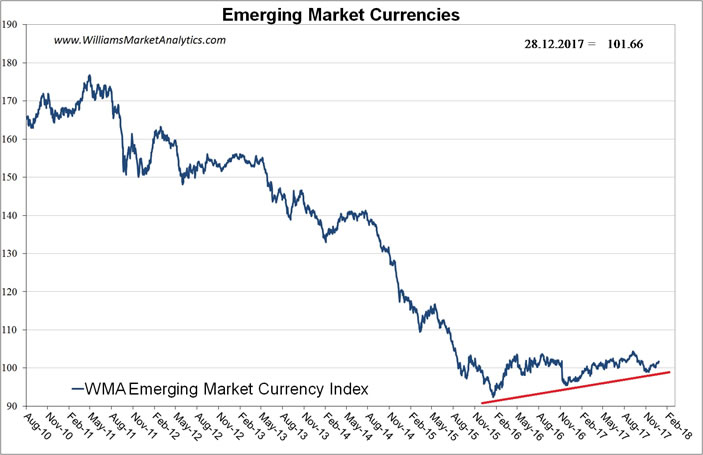
Aside the apparent capitulation vis-à-vis EM currencies, leaving significant upside potential, fundamentals may also support stronger emerging currencies versus the dollar. Long-run economic growth prospects remain more attractive in emerging countries which, à priori, should support local currency prices. Firmer commodity prices (see our Commodity Outlook section) typically also provide a tailwind to EM currencies. Finally, emerging countries have not undertaken the quantitative easing shenanigans that the U.S. and other developed nations have resorted to. Disequilibria are therefore less pronounced in the EM regions and debt levels (with a couple of exceptions like China) have not ballooned over the past years as is the case in the U.S. and developed nations. Healthier national finances will be “rewarded” in the long-term by inflows into EM national currencies.
V. Commodities Markets Perspectives
Commodities play a major role in the global economy, whether the materials are extracted from the earth or refined or produced in a manufacturing process. These materials include oil and gas, industrial metals like copper, lead, zinc, cobalt, precious metal, rare earth metals, iron ore, or aluminum. They might be chemicals, agricultural commodities, lumber or what are referred to as soft commodities like cotton and the like. These products are real, and the shares of their producers have intrinsic value that can be assessed and compared to market price.
Commodity prices are affected by many factors, but over the long-run mostly by economic growth, geopolitical concerns, production supply-demand, interest rates, forex rates, inflation rates, money supply and to some extent by seasonal factors like weather. Without getting into the nebulous world of super-cycles, we believe that long, intermediate and short-term trends and cycles are set in motion and then heavily dependent when two, three or more of the causative factors start acting in unison. The biggest catalyst we believe is the Fed. Then, human emotion, as much as anything, pushes prices through peaks and valleys. Extreme moves almost never happen in a free economy without the intervention of major media and the influence of promoters, typically using Fed speeches and policy actions as fodder.
In the short-run, because market prices of commodities are more volatile than share prices of industrial companies, traders know that commodity price trends and cycles are usually exaggerated on the high and low side.
Bottom line: Value and price are often quite at odds. The differences are what wealth managers seek to understand and exploit by way of active trading. Volatility of price leads to risk as well as opportunity for gain. However, if somebody professes an expertise in picking commodity price cycle tops and bottoms, whether basing their work on fundamentals or technicals, that somebody is not us. Even the big dog commodity industry players usually miss the mark. Nevertheless, asset allocation is important to the owners and managers of capital accounts; so, we make the effort to invest as best we can with a minimum of speculation. In this regard, we are long-cycle trend followers, not speculators.
With the risk-reward concept in mind, our studies are showing that the major driver of commodity price growth in 2017, particularly in 2H2017, was not economic growth and commodity demand as per the usual narrative, but in fact the lack of production supply caused by (i) too little capital investment in recent years to build industry reserves that are needed to replace anticipated draw-downs, which cannot be quickly rebuilt, and (ii) production constraining agreements like the one in oil and gas by OPEC and Russia.
Recently, inflation factors are said to be causing central banks to raise their rates. However, that is an argument that central banks are advancing because they need to normalize rates and eventually put the bond market back on an even keel. We do not believe inflation is a problem although the rate raising policies of central banks may yet cause a problem to happen in the next few years.
Most of the most important commodity prices bottomed between December 2015 and February 2016, and have since risen dramatically. Trend followers are invested. Going into 2018, we know that most investors are still under-weighted oil & gas and metals.
Copper prices bottomed in January-February 2016 at roughly $1.95/lb and have had a steady rise to about $3.30 in recent days, up almost +70% off the low. As 2017 ended, Copper lifted +13.7% from $2.92/lb to $3.32 between December 12 and 28. Many industry players are now reported to believe the bull cycle might extend until the price reaches the $5.00 level; however, we anticipate 2018 volatility ranging from $3 to $4 with an average of $3.65/lb. In that scenario, Copperminer share prices would at least double in 2018.
Oil & Gas prices have also been trending higher, which we believe will result in a doubling of Oiler share prices in 2018.
West Texas Intermediate (WTI) prices bottomed in January 2016 at roughly $28/bbl and, despite the outpouring of negative media, have more than doubled since. Given that producer all-in sustaining costs (AISC) are likely to be at least $60/bbl, we are not surprised to see WTI at the current $60 level. For 2018, we anticipate WTI to average $65 within a range of $55 to $75, perhaps as high as $80 on the high side. This is still a contrarian view.
The Natural Gas market languished in 2017 despite (a) recently oversold price levels that might be reviving, (b) bullish-looking technical indicators, (c) industry inventories that are below past 5-year averages, and (d) weather-based seasonality factors, including some of the Northern US and Canada’s coldest early winter conditions in several years. In fact, despite the extreme cold as 2017 came to a close, the February future (NGG8 $2.91/Million BTU) is still priced at greater than -10% discounts to November highs and well below the 2016-2017 winter prices. Nevertheless, just like for WTI, we anticipate average Nat Gas prices for 2018 to be significantly higher than in 2017, averaging $3.50/Mbtu, perhaps priced during the year as high as $4.00/Mbtu.
Gold prices bottomed in December 2015 at just over $1000/oz and after peaking at close to $1370 in July 2016, a gain of about +37%, has over the past 18 months see-sawed to its present level at around $1292. Earlier in the year, we had forecast one more test of the $1050/oz low; however, we now believe that the Gold price is headed higher, not lower, in 2018 with an average price of $1400/oz. We also believe that, based on (a) sustaining capex deficiency during 2015-2017, (b) cost inflation to come in 2018, (c) demand growth of the rapidly increasing middle-class population of India and China, and (d) extreme speculation apparent today in technology stocks and cryptocurrencies that may switch to precious metals in 2018, it’s possible that this Gold price cycle could be virtually unlimited on the high side if central bankers and bitcoin speculators decide to back digital money with precious metals as their alternative to fiat currency.
Silver prices bottomed in January 2016 at about $13.75/oz and after peaking at close to $21 in July 2016, a gain of about +50%, then dropped close to -25% over the past 18 months. In a bullish precious metals market, we expect Silver to outperform Gold.
There are too many commodities to cover here, so we will limit the remaining discussion to Lumber. Prices bottomed as long ago as September 2015 at under $220 and then gained +140% to hit an astounding all-time high of $US500 in November 2017, dropping back a bit to $450 after Trump-inspired duties on Canadian softwood lumber used by US housebuilders are now expected to be lower than had been initially discussed. Analysts might fairly accurately forecast lumber demand for construction; however, the major driver in 2018 will be the re-working of NAFTA, which is very much a speculation at this point.
With one eye on our job as asset allocators and the other watching the Fed and the public’s reaction to it, there is one chart in particular that I think will help us assess the prospects for 2018. This is the chart that follows of commodity prices represented by the DBC Commodity Tracking ETF (light green) and the 10-year US Treasury Rate (blue) lines overlaid on the area chart of the Nasdaq 100 index (QQQ). Several points of important market history of the past 20 years are shown.
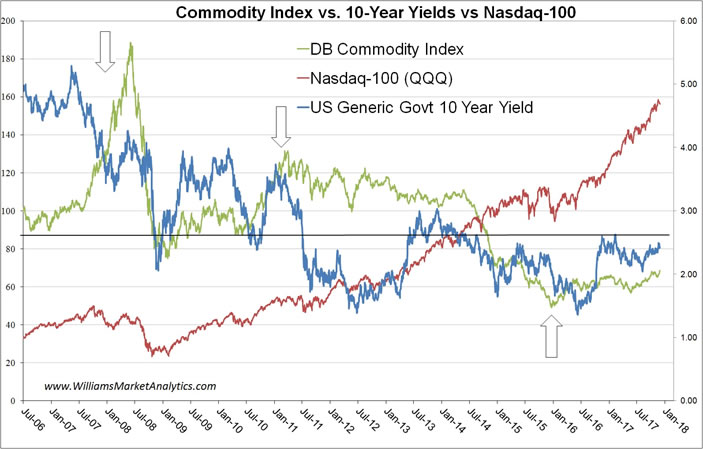
This chart shows that technology stocks, as represented by the Nasdaq 100 index, are even more over-valued today than they were during the 1999-2000 Internet bubble. More importantly, it also shows that in every case the US Federal Reserve Bank has acted as a major disruptor of prices – of commodities as well as equities. So, our task to assess the future is to study where we’ve been.
The Fed raised rates in the late 1990’s to such a high level that the equity market collapsed from its peak in 1Q2000 to its bottom in 4Q2002, only recovering after the Fed dropped rates a couple months earlier. But that also got investors very interested in commodities, which had not been the case for 20 years. But higher commodity prices then led the Fed to start raising rates again, ultimately causing the equity market to stall and the public to complain about the health of the US economy. With the economy in disarray, Hank Paulson was parachuted from head of Goldman Sachs into his role as US Treasury Secretary in 2Q2006. Sec. Paulson then worked with the Fed to drop interest rates and pump up the equity market, each of them telling Americans their policies were about job creation. Consequently, with lower interest rates and easier access to loans, the prices of crude oil, real estate, collectibles and some other commodities zoomed out of control from the beginning of 3Q2007 – Lumber prices jumped from $200 to $300 in a few weeks -- so, the central bank then intervened again to halt inflation by removing liquidity in the financial system. However, they overdid that to the point the WTI Crude Oil price collapsed from over $140/bbl to under $35 and the real estate mortgage market failed causing widespread bankruptcy which caused the commercial banks to fail and the equity market to collapse. Without mortgages, home building virtually stopped, and Lumber contracts dropped to $140. After a series of Fed panic measures called quantitative easing, WTI was soon back to $110 and Gold to $1900. So, early in 2Q2011, the Fed again intervened to knock down the price of these commodities. By the end of 2015, WTI had plunged again to below $30/bbl and Gold to below $1050/oz, which may have made short-sellers on Wall street happy, but simply were not sustainable in a healthy economy.
Here we are at the end of 2017. Presently, tech stocks are soaring out of control to an extent not seen since tech became popular in the 1950’s after IBM in 1952 introduced its first mainframe computer, which was based on the vacuum tube. But the Fed now has a problem bigger than 2007. If they raise rates too high and too fast now, the US economy will surely fail at some early point because of the excessive credit already in the system that sooner or later will lead to widespread credit failures and bankruptcies. So, what’s happening now is that the Fed needs a scapegoat. That could be cryptocurrency or general speculation mania; however, although debatable in many quarters, the bitcoin phenomenon is likely to implode on its own, especially when governments take direct control of these digital currencies and tax the profiteers. More likely, the Fed will allow commodity prices to rise through 2018, raising rates all the time (four rate hikes in 2017 will likely be followed by three or four in 2018 and another two or three in 2019, combining to push Fed rates higher by +1.0% at the end of 2018). Of course, the Fed will blame their higher rates on inflation even though, while it exists, inflation is not yet a problem. Given enough time, Fed policies will have caused that inflation.
Bottom line: While 2016-2017 gains in commodity prices are a pittance compared to those of the usual cryptocurrency names, commodities do represent real products that are essential to the global economy, and the economy is growing today at rates well above the long-term norm, with no end in sight. With the volatility extremes caused by media-fanned emotions, we anticipate that 2018 will close with higher commodity prices. Moreover, we believe that commodity prices, which are now trending higher consistent with equity prices, will lift higher and longer than the broad equity market, as and until the Fed pushes rates above and beyond a sustainable level, which we believe to be at 3.5%, occurring sometime in 2020.
In the interim period, as prudent investors switch their priorities from chasing over-priced technology stock prices to seeking shares of undervalued companies, we think there are several implications. While the broad equity market indexes might lift to new record levels in 2018, led many believe by lower U.S. corporate tax rates, we think that the main driver will be commodity-related equities that will boom by over 100%. In many cases, particularly the smaller cap commodity producers, the gains ought to be even much higher. In any case, it’s going to be an exciting year for many Natural Resource stocks.
VI. Equity Market Outlook
The calls for the S&P 500 reaching 3000 are becoming widespread. The most hated bull market a couple years ago is now seeing investors falling in love with the entire market. The most popular strategies (notably technology) are creating self-perpetuating flows of capital and significant risk. Consensus calls for equity indexes to post strong gains in 2018 need to be taken with a grain of salt. At the end of 2007, the same consensus forecasters predicted on average +14% gains for U.S. equities in 2008.
Downside risks are more elevated in the equity market going into 2018 than in the bond market, even with higher-than-expected inflation. While betting on the U.S. equity market is the status quo allocation decision, the risk/reward ratio for the trade gets less attractive each day. Our main concern is the degree of speculation in the market. Maybe the U.S. economy reaches 6% annual GDP growth and earnings justify the valuations currently attached to stock prices. But the onus is now on the speculators. If the scenario imagined by those piling into U.S. stocks today does not completely materialize, equity prices will come down fast. The term used is “priced for perfection”. And as perfection rarely is achieved, we do not see the U.S. equity market as the best bet for 2018.
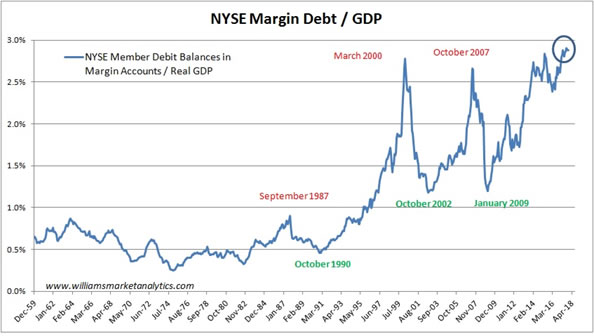
One of our favorite charts to illustrate the degree of speculation in U.S. equities today is the ratio of Margin Debt-to-GDP. When the market turns, like in 2000 and 2007, speculators who borrowed money to leverage up long positions will have to unwind and get out as losses mount.
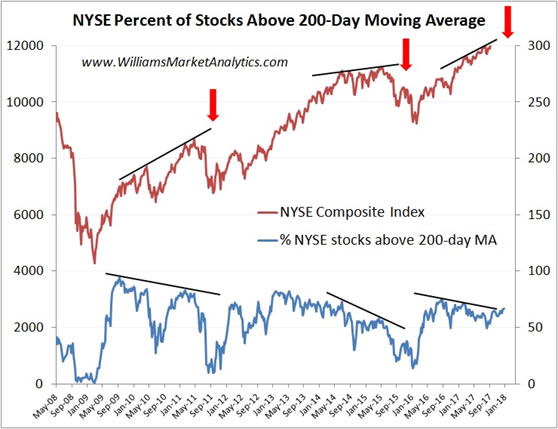
The narrow participation in the U.S. equity rally is also a concern. Only 67% of NYSE stocks trading above their 200-day moving averages. In previous cases this cycle when the % above 200-day moving average was trending down, and the NYSE Composite Index was making new highs, the end result was a sharp price correction in equities. If the blue curve below begins to make new highs with the NYSE Composite Index (in red), we would be less concerned about market breadth.
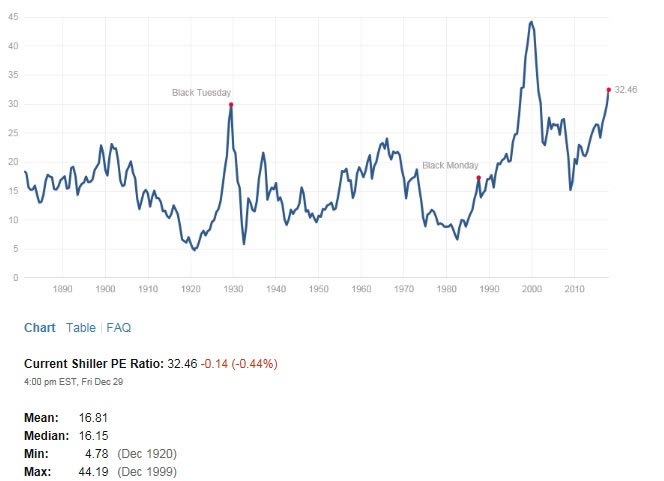
U.S. equity valuations remain up for debate, as many Wall Street bulls believe that current valuations are justified by higher earnings prospects (as they always are at the end of a cycle). We follow the Shiller P/E to better put current valuations in a historical context. As of year-end 2017, the cyclically adjusted P/E ratio (CAPE) stood at 32.46x. Sure, the Shiller P/E reached the 40s at the height of the tech bubble, suggesting more exaggeration is possible. At the same time current CAPE ratio has surpassed the Black Tuesday high in 1929. We’ll just say U.S. equity valuations are in the “red zone”.
In sum, the U.S. equity market risk/reward ratio compels us to look at markets abroad for 2018 equity allocations.
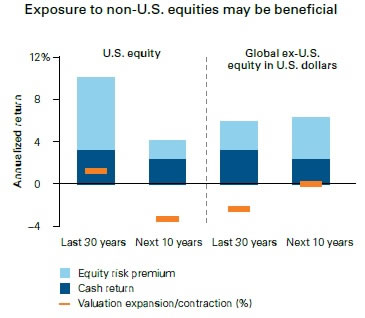
The next chart shows the expected return outlook for U.S. equities over the next decade is centered around 3% to 5% on an annual basis. Global equity returns are forecast between 5% to 7% annually over the next decade. While forecasts are always wrong (no one can predict the path world economic growth will take nor the end game of nine years of central bank market manipulation), we strongly believe that the spread between U.S. and Global equity returns will be many multiples of this forecast, obviously in favor of global equities. Moreover, valuation is forecast to be a headwind for U.S. equities over the next 10.year (orange dash), whereas valuations should become relatively more compelling for Global equities going forward.
Europe is relatively more attractive than the U.S. at this stage, but far from a slam dunk. ECB quantitative easing and low interest rates will outlast the Fed. For those gaming the central banks, European equities are a better option. The question remains, how much longer will gaming central bank accommodative policies work?
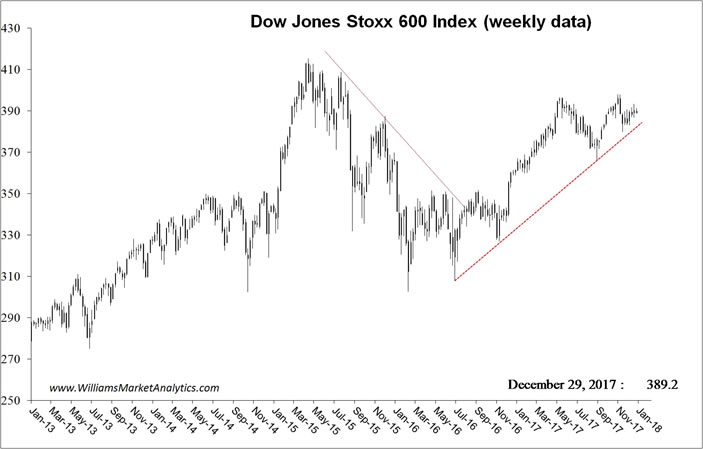
Below is the DJ Stoxx 600 Pan-European Index. The index has struggled this year with the strong euro currency. While European equities are still not at record highs like the U.S. indexes, enthusiasm for ECB quantitative easing is tempered by the risk of seeing the dollar continue to weaken (and the euro rise). We would market weight (at most) any allocation to currency-sensitive European exporters. Allocations to the broad indexes (DAX, CAC40, Eurostoxx 50) are less advised as opposed to picking individual names in Europe less exposed to euro strength.
Among other developed equity markets, we would avoid Japan. With debt/GDP at 250%, a central bank printing money and buying Japanese equities to keep the economy afloat, and structural headwinds (such as demographics) Japanese equities are unattractive for an equity allocation. Moreover, with the Nikkei 225 reaching levels last seen in 1996 after the bust, the exit is looking like the most attractive bet on Japan.
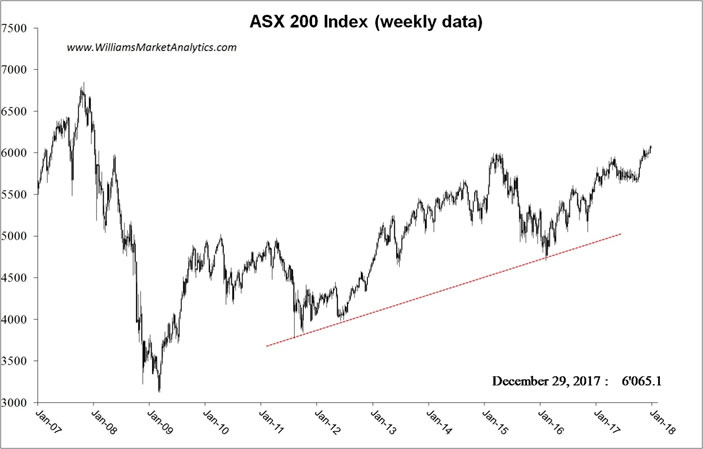
Canada and Australia are two alternatives markets to consider for an equity allocation. Neither country has plunged too far into the quantitative easing Kool-Aid and national equity indexes, while elevated, are far from parabolic. The Canadian TSX is only 6% above 2008 highs while the Australian ASX 200 (below) is -10% below 2007 highs. Moreover these two “commodity countries” have currencies that move pro-cyclically with commodity prices and offer relatively greater exposure to miners and oilers.
Our preferred equity allocation for 2018 goes to emerging markets. As a whole, emerging markets have underperformed since 2009. We demonstrated in our August 25, 2017 Commentary that the assets which are responsible for a bubble (or run up due to a bubble) both fall further in the ensuing bear market AND underperform in the subsequent bull market. We cited the cases of Japan (1982-1990), Technology (1992-2000), Housing (2002-2006), China (2007), and Banks (2008-2009). With the entire U.S. equity market being the bubble asset in the “Fed Bubble”, we recommend getting far away from the U.S. for the next stock market cycle. Many emerging equity markets look attractive in this regard.
Forecasted growth in emerging market countries is expected to be 4.9% in 2018, towards the lower end of the trend growth range since the Financial Crisis. Provided the U.S. avoids a financial accident, which would cause a negative spillover for EM regions, we expect growth in emerging markets to outpace U.S. economic growth, despite all the fanfare over the Trump tax cuts. Growth in the EM region will be nonetheless quite disparate. The following chart shows the IMF’s growth forecasts for the main regions for 2018-2022. Emerging Asia is likely to continue to exhibit the strongest growth rate over the next four years (6.68%), only slightly down from the trailing four year period. Emerging Europe is relative less attractive, as GDP growth is forecast to slow significantly over the coming years. Russian equities may still do well given our forecast for higher crude oil prices, but taking the political risk does not seem prudent.
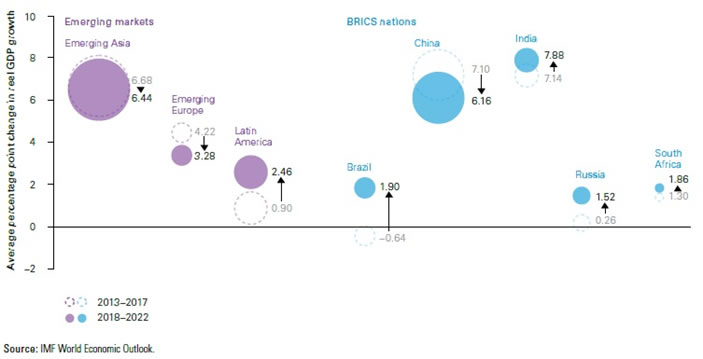
Finally Latin American growth is set to rebound in the next four years, putting this region on our radar. After sluggish growth in most Lat Am countries over the past four (with Brazil just emerging in 2017 from a severe recession which began in 2014), IMF forecasts show a rebound to 1.90% GDP for the region as a whole.
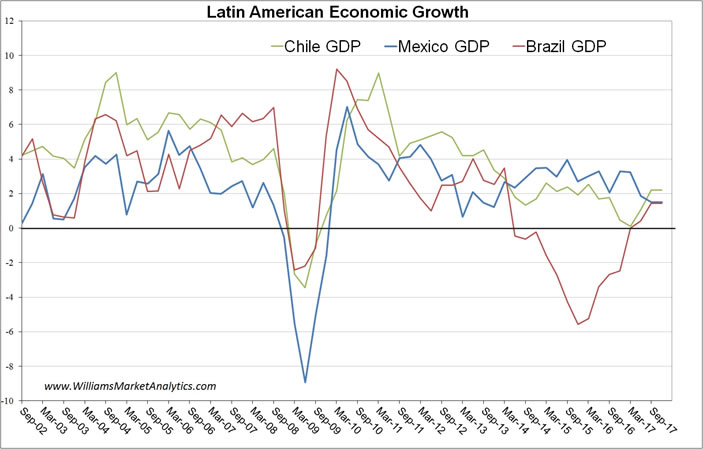
As shown in the chart above, the three largest Lat Am economies have been slowing since 2011. With Brazil coming out of recession, we believe that the largest economy in South American will pull up growth for the entire region.
Beginning in Asia, our preferred countries include China, Malaysia, and Singapore. India remains attractive fundamentally, but prices are now very elevated.
Following a decade of aggressive credit expansion, China’s credit profile has stabilized recently, as tighter financial controls and a rebound in nominal growth helped stunt a rise in corporate liabilities—the crux of China’s debt fears. Alongside tighter property regulations and supply-side adjustments, the financial tightening is likely to cause China to decelerate modestly in 2018, reaching about 6.0%–6.5%.
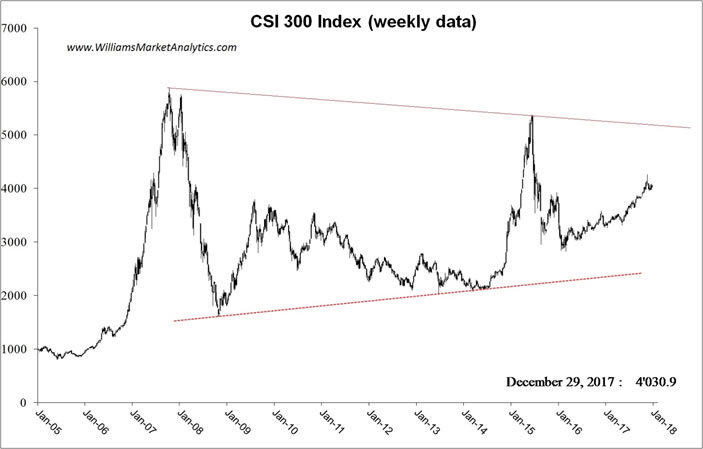
Among the positive factors for China going forward, the oversupply and overcapacity drags in the real estate and heavy industrial sectors, which have weighed on China’s investment growth for years, are likely to be less intense going forward. Equity valuations also looked less stretched today, at least of a relative basis, compared to developed equity markets. The CSI 300 Index below (mainland China shares), which has had a history of boom/bust, appears to be in a more measured cycle of gains this time (relative to 2007 and 2015). We are hoping that the gradual pace of gains currently seen will be more sustainable.
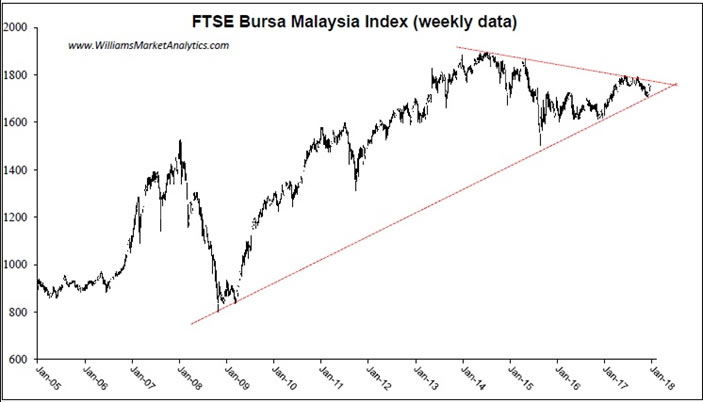
We like Malaysia and Singapore both for the fiscal stability these countries offer (with a good potential for currency gains for foreign investors) and the reasonable valuations. Neither index has run up to the degree most world equity benchmarks have, implying more upside potential and possibly less downside risk. Below is the Malaysian equity benchmark index.
Latin American stocks have been the relative losers this cycle. As headwinds ease, we see Lat Am stocks as a good investment opportunity. In Brazil, the political corruption scandals hitting the state leaders, as well as the financial crisis stemming from increasing budget deficits, have by now been well digested by the markets. As is customary, stock markets rally before an economic comes out of recession. This has been the case with the Bovespa, which is up +100% from cycle lows in 2016. Brazil remains a market to buy on any pull-back. Mexico and Chile remain in firmly established uptrends and, outside normal stock market volatility, we cannot foresee a major bear market hitting any of these regions in 2018.
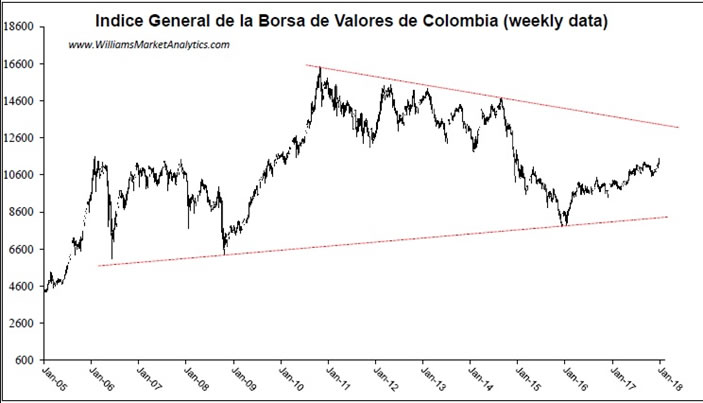
Finally Peru and Colombia, the laggards in the global stock market orgy of the past two years, remain well below prior cycle highs. The Colombian stock market (below) is our top region pick for the next year.
In terms of 2018 sector bets, a few industries stand out.
- Energy companies. The lift-off in West Texas crude prices may be the trigger to light a fire under the one sector that has underperformed the most since 2014.
- Miners. Precious metal miners will have their day in the sun once inflation exceeds expectations.
- Banks. A new regulatory regime ushered in by Trump should support bank stocks in 2018.
- Industrial Robotics. Manufacturers are increasingly relying on efficiency, driven by better artificial intelligence and robotic capabilities. For a selection of companies in this industry, check out the component stocks of the ROBO tracker fund.
- Power Providers. After years of being a net negative for many utility companies, the supply/demand dynamic in many parts of the U.S. may be about to change. That could mean a big opportunity for some power providers.
- Infrastructure. With tax reform done, Trump is turning his attention in 2018 to rebuilding America’s crumbling infrastructure. The WMA Roads, Bridges, & Water Index tracker is how we recommend getting exposure to this Trump agenda item.
Among our sectors to avoid, we’d stay away from the momentum stocks, such as technology and the Dow Jones Industrial Average component stocks. It will be impossible to know which sell-off will keep going down, until it becomes too painful to sell. And selling each dip in the interim is a costly trading endeavor.
For investors interested in the energy and mining sectors, our associate and industry expert Bill Cara is managing the WMA Natural Resources portfolio. The resources sector is emerging from a bear market and fundamental conditions are now offering tailwinds. Bill is keeping the portfolio is the top companies and dynamically weighting the portfolio between the miners and oilers.
VII. Final Thoughts For 2018
After a year of superlative in 2017, it’s hard to imagine what global equities in general, and U.S. equities in particular, will do for an encore in 2018. After a year of complacency, in which selling volatility proved to be the most winning trade, we are dubitative that 2018 will see a repeat of 2017. Market returns have risen with (and even exceeded) improving fundamentals. Although evidence of financial bubbles is still debatable, risk premiums for many asset classes appear slim. It is often said that investors should “go with the flow until markets reach an extreme, then reverse positions”. The problem is that “extreme” has been difficult to pin down. Nonetheless, we believe it is too late to continue playing momentum stocks. Savvy investors must now seek out new investment themes, including some that we mentioned above.
In any case, we see risking risks to the status quo. Higher risks and lower returns would seem to almost be a certainty in 2018. Elevated valuations, low volatility, and secularly low bond yields are unlikely to be allies for robust financial market returns over the next five years. Overall, the risk of a correction for equities and other high-beta assets is considerably higher than for high-quality fixed income portfolios, whose expected returns are only positive in nominal terms looking out five years.
In terms of events that could provoke the onset of the next bear market, we believe investors just need to follow the money. When liquidity is sufficiently removed from financial markets (central bank tightening, fiscal tax/spending moderates), the oxygen to keep this balloon afloat will disappear. We do not believe geopolitical events, including a possible conflict with North Korea, will have more than an ephemeral effect on markets. Only news that impacts the liquidity of markets will pose a trend-changing threat to asset prices.
Although it sound mundane, diversification will be especially important over the next years. The central bank monetary policy experiment will produce an uncertain outcome. It’s hard to believe that exiting extraordinary moment policy measures will be anything but disruptive to financial markets. And the longer central rates hold interest rates down and prop equity markets up, the more violent the day of reckoning will become. However for investors who manage risk and think outside the box, instead of following the crowd, the financial markets need not be perceived as perilous in coming years.
We wish all a healthy and prosperous New Year!
By
© 2005-2022 http://www.MarketOracle.co.uk - The Market Oracle is a FREE Daily Financial Markets Analysis & Forecasting online publication.