


Crude Oil – It Smells Like… Profits
Commodities / Crude Oil Mar 02, 2018 - 07:28 AM GMTBy: Nadia_Simmons

 Although oil bulls pushed black gold higher after yesterday market’s open, their triumph was very short-lived. Looking at the daily chart, it even tempts to say that their rally took place on an empty tank. Why? Because thanks to yesterday’s decline oil bears not only made short positions more profitable, but also gained next pieces to their puzzle. Let's check them together in today's alert.
Today's alert will start a little differently than usual, because we will take you on a small journey to the past and we’ll recall the quote from our Oil Trading Alert posted on Friday:
(…) In our opinion, the pro-bearish scenario is also reinforced by the fundamental factors. (…) EIA data showed that the U.S. output remains above 10 million barrels per day, which keeps domestic production on track to meet the earlier estimate for an increase to 11 million barrels per day in late 2018. If American drillers will not let down, the U.S. will overtake Russia in crude oil production and become the largest global supplier. Such development will likely not please Saudi Arabia and may thwart OPEC efforts to reduce black gold’s stockpiles, increasing worries over another crude oil glut. In such an environment oil bulls could have problems keeping the price not only above $60, but also above the psychological barrier of $50.
From today’s point of view, it seems to us that our gloomy (at least for the bulls) vision of the crude oil’s future from the previous week slowly begins to take on real shapes. Those of you who watched yesterday's EIA data already know that the report showed a larger than expected increase in crude oil inventories.
For those who missed yesterday's numbers, we remind that crude oil stockpiles increased by 3.019 million barrels for the week ended Feb. 23, missing forecasts for a rise of 2.4 million barrels. Additionally, gasoline inventories rose by 2.483 million barrels, disappointing expectations for a decline of 190,000 barrels.
On top of that, U. S. production jumped to 10.3 million barrels per day, hitting a new record high. In this way, the output increased more than 20% since mid-2016, which suggests that soaring oil production could fill the gap in supply created by the OPEC and non-OPEC producers in the coming months. If the situation in the oil market develops in line with the above assumption, fears that the U.S. drillers activity could dampen earlier efforts to cut supplies, will likely push the price lower in the coming weeks and maybe even months.
At this point, you can ask the question: why are you so pro-bearish? Well, we think that after the last “crude oil’s price war” U.S. drillers learned a lot about their opponents’ tolerance for declining prices and worked quite hard to reduce production costs from months. If this is the case, they likely know how to get much more oil even if they need to reduce the number of active oil rigs.
In our opinion, these circumstances in combination with the technical picture of black gold give pretty good foundations for oil bears’ activities and their pro-declining scenario. With the above in mind, let’s check the charts below and find out who has more arguments on their side at the moment of writing these words.
Crude Oil’s Technical Picture
Let's start with the current picture of crude oil (charts courtesy of http://stockcharts.com).
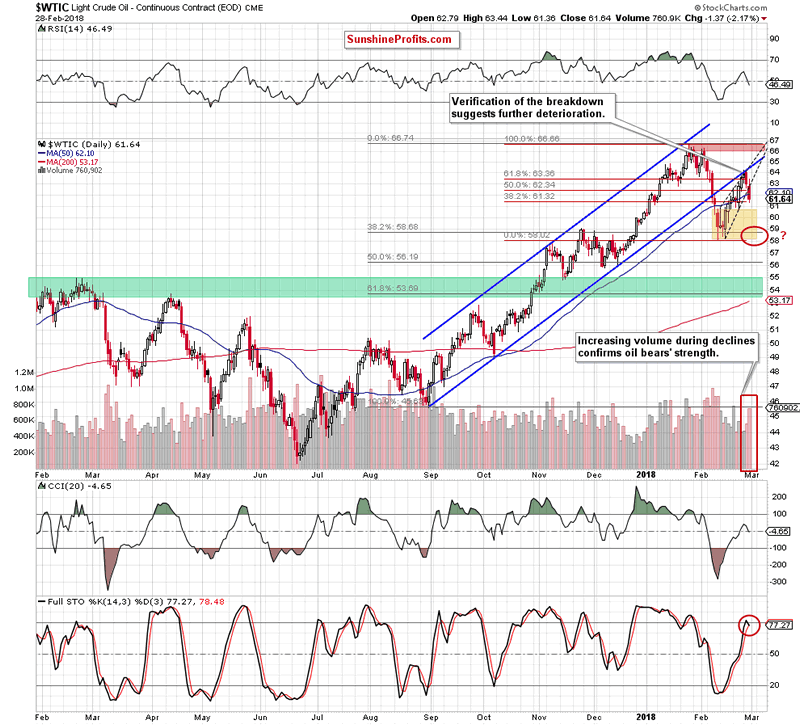
On Wednesday, we wrote that oil bears finally showed their claws during yesterday’s session. Thanks to their attack black gold pulled back and not only moved away from the lower line of the blue rising trend channel, but also invalidated the earlier breakout above the 61.8% Fibonacci retracement.
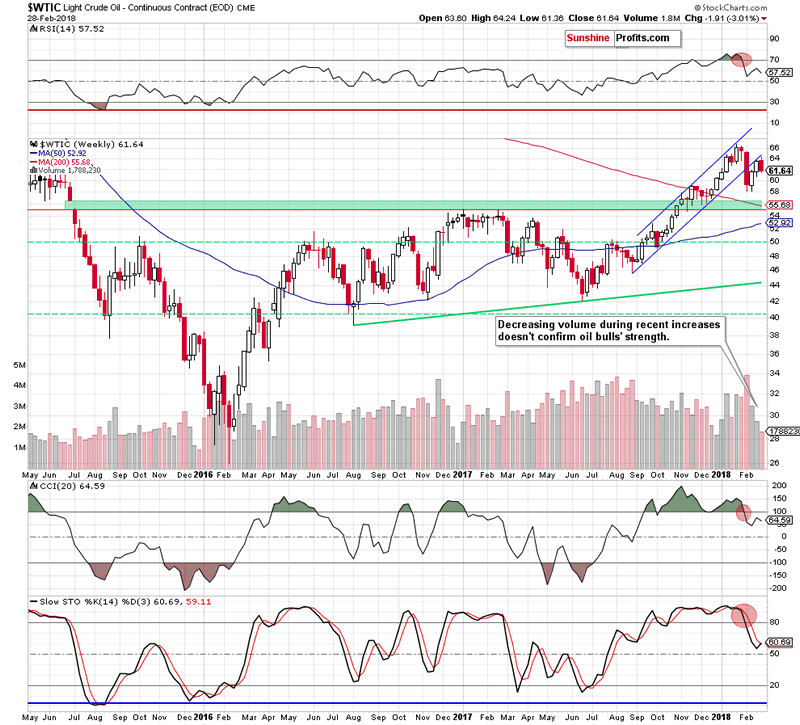
Additionally, yesterday’s decline materialized on higher volume, suggesting that oil bears may gathering forces for the next attack in the coming days. This scenario is also reinforced by the current volume seen on the weekly chart.
From today’s point of view, we see that oil bears took the price of crude oil lower as we had expected. As we mentioned earlier, thanks to yesterday’s decline they gained next pieces to their puzzle. In other words, the sellers gained new allies who can support their pro-decline scenario.
Who they are?
The first of them is the above-mentioned fundamental picture of the oil market, which looks quite gloomy from the bulls’ point of view.
The second one is the verification of the breakdown under the lower border of the blue declining trend channel, which negative impact on the price remains in the effect.
And speaking about the verification…. When we take a closer look at the daily chart, we also notice that thanks to yesterday’s upswing after the market’s open light crude also verified the earlier breakdown under the previously-broken 61.8% Fibonacci retracement, which gave oil bears another reason to act.
The third ally is an invalidation of the earlier breakout above the 50% retracement.
The fourth is the breakdown below the lower border of the very short-term black rising wedge (we marked it with the black dashed lines). This development suggest that the commodity will drop to (at least) the area where the size of the downward move will correspond to the height of the formation (don’t worry, we will introduce you this level a bit later).
The fifth is an invalidation of the breakout above the 50-day moving average.
The sixth is the well known from our previous alerts volume. As you see on the daily chart, it moved visibly higher during yesterday’s decline, confirming the engagement of the bears in the fight for lower prices of crude oil.
The seventh ally is the sell signal generated by the daily Stochastic Oscillator.
Do the bears have some more aces up their sleeves?
In our opinion, at least one – the strengthening dollar.
What do we mean by that? Let us remind you the quote from our article published on February 23, 2018:
(…) higher values of the U.S. currency often weigh on prices of dollar-denominated commodities. For example, fuel imports for countries using other currencies become more expensive and potentially could even limit demand.
With the above in mind, we decided to check once again what happened with the USD Index since the above-mentioned alert was posted.
Crude Oil - U.S. Dollar Link Is Holding Tight
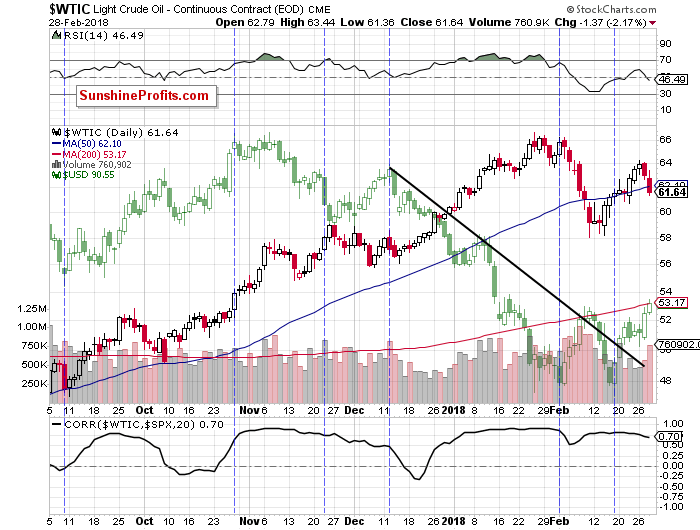
Looking at the current relationship between our “heroes”, we clearly see that the negative correlation remains in the cards, indicating that higher values of the USD Index will translate into lower prices of black gold if this tendency continues.
What can the U.S. dollar do in the near future?
Let’s examine the charts below to find out.
In our last commentary on the U.S. currency, we wrote the following:
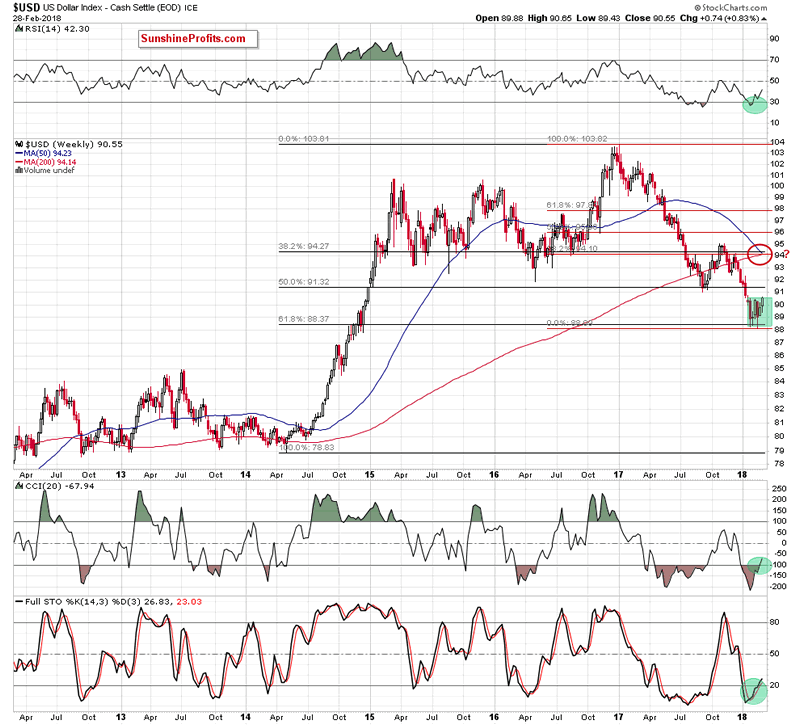
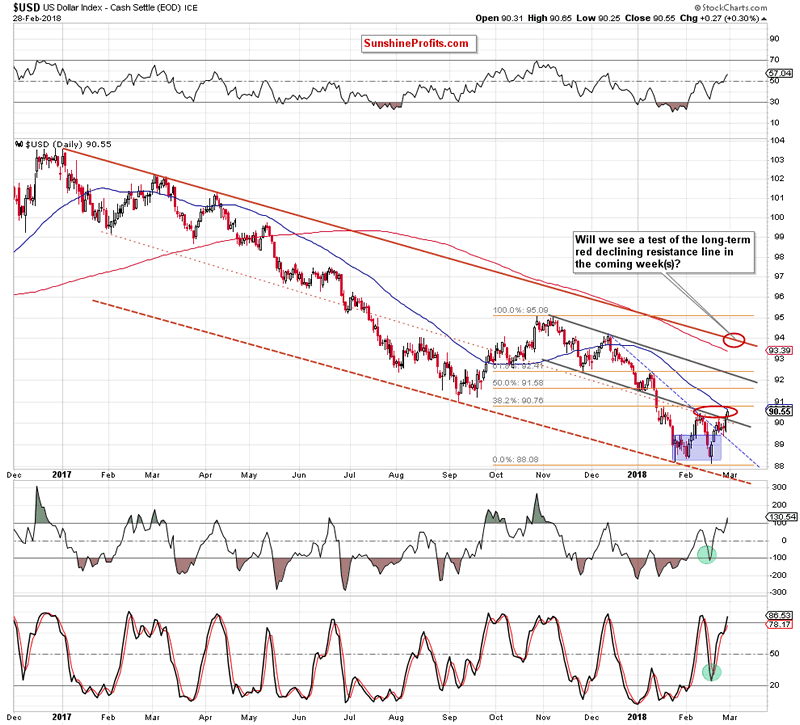
(…) the breakout above the short-term blue declining resistance line based on the mid-December 2017 and January 2018 peaks (…) was quite bullish development (…) the buy signals generated by the daily indicators encouraged currency bulls to push the index higher, but the lower line of the grey declining trend channel stopped them once again, triggering a pullback. Thanks to this drop, the greenback moved to the previously-broken blue line, which looks like a verification of the earlier breakout.
If this is the case, and the index rebounds from here (which is quite likely as the buy signals remain in the cards), we’ll likely see not only a re-test of the lower grey line, but also a climb to the 38.2% Fibonacci retracement, which intersects the upper line of the green consolidation marked on the weekly chart.
On the above chart, we see that the buyers pushed the USD Index higher in recent days, which resulted in an invalidation of the earlier breakdown under the lower border of the grey declining trend channel. Taking this bullish development into account and combining it with the buy signals generated by the weekly indicators and the lack of the sell signals generated by the daily indicators it seems to us that the greenback will climb not only to our above-mentioned target, but also try to go higher.
Nevertheless, taking into account the importance of this zone, we will keep an eye on this area and crude oil’s response to the upswings/downswings of the U.S. currency and keep you - our subscribers - informed should anything change, or should we see a confirmation/invalidation of the above.
After examining the all the above factors affecting the price of crude oil, it is time for the most important question of the day: how low could black gold go?
In our opinion, if light crude extends declines from current levels, we’ll see a downward move to at least February lows in the coming days (we marked this area with the red ellipse on the daily chart).
Summing up, short (already profitable) positions continue to be justified from the risk/reward perspective as crude oil extended losses after the verification of the earlier breakdown under the lower line of the blue rising tend channel and the previously-broken 61.8% Fibonacci retracement, which together with all the above-mentioned technical and fundamental factors increase the probability of further deterioration and the test of the February lows in the coming week.
If you enjoyed the above analysis and would like to receive free follow-ups, we encourage you to sign up for our daily newsletter – it’s free and if you don’t like it, you can unsubscribe with just 2 clicks. If you sign up today, you’ll also get 7 days of free access to our premium daily Oil Trading Alerts as well as Gold & Silver Trading Alerts. Sign up now.
Nadia Simmons
Forex & Oil Trading Strategist
Przemyslaw Radomski
Founder, Editor-in-chief
Sunshine Profits: Gold & Silver, Forex, Bitcoin, Crude Oil & Stocks
Stay updated: sign up for our free mailing list today
* * * * *
Disclaimer
All essays, research and information found above represent analyses and opinions of Nadia Simmons and Sunshine Profits' associates only. As such, it may prove wrong and be a subject to change without notice. Opinions and analyses were based on data available to authors of respective essays at the time of writing. Although the information provided above is based on careful research and sources that are believed to be accurate, Nadia Simmons and his associates do not guarantee the accuracy or thoroughness of the data or information reported. The opinions published above are neither an offer nor a recommendation to purchase or sell any securities. Nadia Simmons is not a Registered Securities Advisor. By reading Nadia Simmons’ reports you fully agree that he will not be held responsible or liable for any decisions you make regarding any information provided in these reports. Investing, trading and speculation in any financial markets may involve high risk of loss. Nadia Simmons, Sunshine Profits' employees and affiliates as well as members of their families may have a short or long position in any securities, including those mentioned in any of the reports or essays, and may make additional purchases and/or sales of those securities without notice.
© 2005-2022 http://www.MarketOracle.co.uk - The Market Oracle is a FREE Daily Financial Markets Analysis & Forecasting online publication.