


Stocks End a Wild Quarter, as Bulls Scratch Their Heads
Stock-Markets / Stock Markets 2018 Mar 29, 2018 - 09:47 PM GMTBy: Paul_Rejczak

 Wednesday's trading session was pretty uneventful compared to Friday's, Monday's and Tuesday's volatility. Stocks fluctuated along their Tuesday's closing prices, as investors hesitated after slightly better-than-expected Final GDP number release. Will stocks rebound today? Or is this just a consolidation before another leg lower? It seems that there are still two possible future scenarios.
The main U.S. stock market indexes were mixed between -0.9% and -0.0% on Wednesday, as investors hesitated following Tuesday's sell-off. The sentiment remained pretty bearish despite some better-than-expected economic data releases. The S&P 500 index fluctuated along the level of 2,600. It is currently 9.4% below January 26 record high of 2,872.87. The Dow Jones Industrial Average lost just 0.05%, and the technology Nasdaq Composite lost 0.9% on Wednesday, following its Tuesday's sell-off of 3.3%.
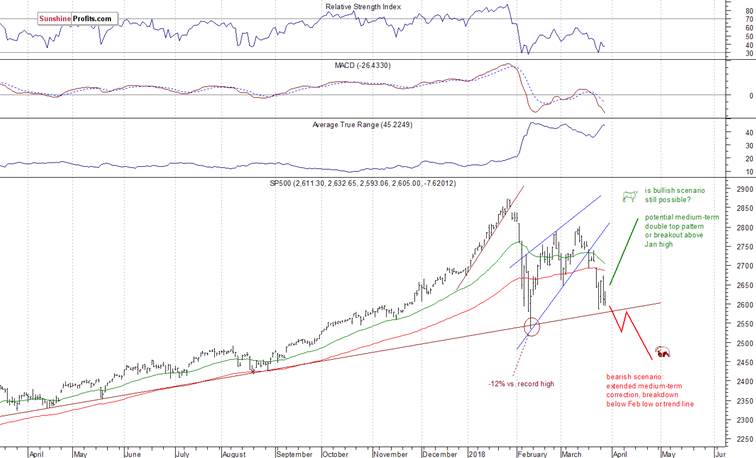
The nearest important level of resistance of the S&P 500 index is at around 2,630-2,635, marked by yesterday's daily high The next resistance level remains at 2,650-2,670, marked by previous consolidation and short-term local highs. The resistance level is also at 2,690-2,710, marked by March 22 daily gap down of 2,695.68-2,709.79. On the other hand, the nearest important support level is at 2,585-2,600, marked by recent local lows.
We can see that stocks reversed their medium-term upward course following whole retracement of January euphoria rally. Then the market bounced off its almost year-long medium-term upward trend line, and it retraced more than 61.8% of the sell-off within a few days of trading. Since then it was fluctuating, and now it is trading close to its upward trend line again. There are two possible future scenarios. The bearish case leading us to February low or lower after breaking below medium-term upward trend line, and the bullish one with medium-term double top pattern or breakout higher. Last week's sell-off made the bearish case much more likely, almost a certainty. Monday's rally gave bulls another chance, but Tuesday's sell-off took it away. You should take notice of a breakdown below potential rising wedge pattern. This over month-long trading range looks like an upward correction following late January - early February sell-off:
Positive Expectations
The index futures contracts trade 0.3-0.6% higher vs. their yesterday's closing prices, so expectations before the opening of today's trading session are positive. The European stock market indexes have gained 0.4-0.8% so far. Investors will wait for some economic data announcements today: Personal Income, Personal Spending, Initial Claims at 8:30 a.m., Chicago PMI at 9:45 a.m., Michigan Sentiment number at 10:00 a.m. The market will probably extend its short-term consolidation, but the volatility may come down after yesterday's sideways action and ahead of long holiday weekend. However, if the index breaks lower, it could continue towards February 9 low of 2,532.69.
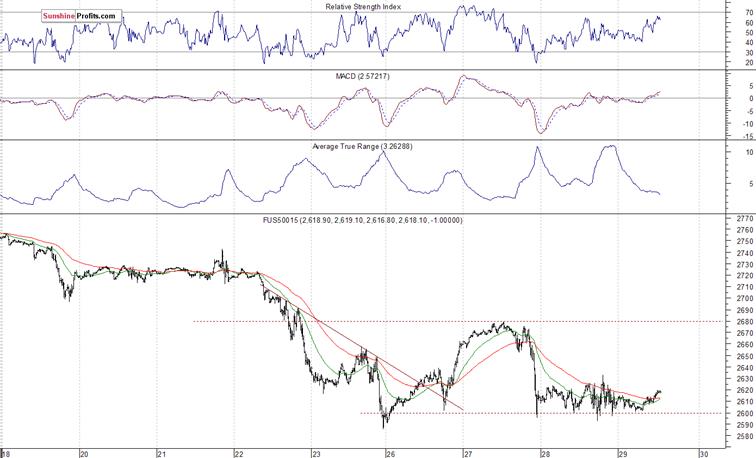
The S&P 500 futures contract trades within an intraday uptrend, as it extends its short-term consolidation along the level of 2,600. The nearest important level of support is at around 2,590-2,600, marked by local lows. On the other hand, level of resistance is at 2,620, and the next resistance level is at 2,650, among others. The futures contract continues to trade above 2,600 mark, as we can see on the 15-minute chart:
Nasdaq Above 6,500 Again
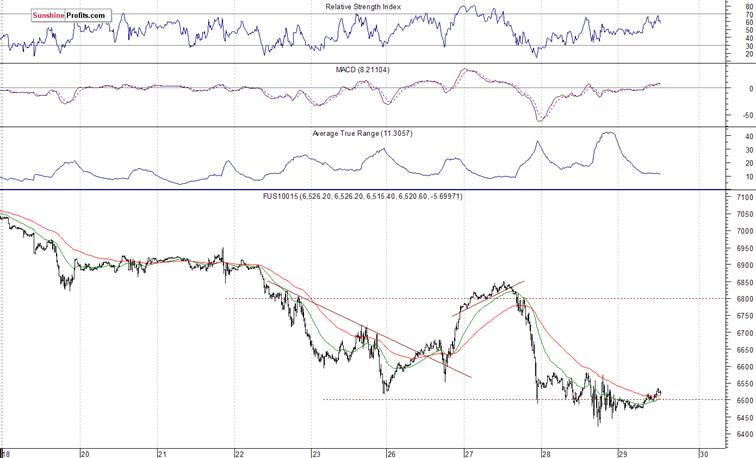
The technology Nasdaq 100 futures contract follows a similar path, as it trades within an intraday uptrend. It accelerated its downtrend on Friday, as it moved towards 6,500 mark. Then it retraced most of its last week's decline on Monday and Tuesday morning. It reached as high as around 6,850, before quickly going down again. The market bounced off around 6,420 yesterday, and it broke above 6,500 mark again this morning. The Nasdaq futures contract extends its short-term fluctuations, as the 15-minute chart shows:
Amazon Stock Plummeted, Apple at Low Again
Let's take a look at Apple, Inc. stock (AAPL) daily chart (chart courtesy of http://stockcharts.com). The market reached new record high on March 13, but then it reversed the uptrend. We saw negative technical divergences - the most common divergences are between asset’s price and some indicator based on it (for instance the index and RSI or MACD based on the index). In this case, the divergence occurs when price forms a higher high and the indicator forms a lower high. It shows us that even though price reaches new highs, the fuel for the uptrend starts running low. The market formed a negative candlestick chart pattern called "bearish engulfing". It consists of a smaller white candlestick followed by a black candlestick that "engulfs" the white one. This downward reversal pattern has been confirmed. Consequently the market continued its downtrend, as it broke below the upward trend line two weeks ago. Since then it accelerated downwards. On Monday we wrote that the price may bounce off support level at $160-165. And it did. Then it reversed lower again, after bouncing off resistance at $175. It may bounce off its Monday's local low again:
Now let's take a look at Amazon.com, Inc. (AMZN) daily chart. It was relatively weaker than the broad stock market yesterday, as it broke below the price of $1,500. It went as low as $1,386.2, before bouncing off and closing "just" 4.4% lower. There were some clear negative technical divergences, along with March 13 bearish engulfing downward reversal pattern. The nearest important support level is at around $1,350, marked by medium-term upward trend line. On the other hand, resistance level is at $1,500, marked by previous level of support, as we can see on the daily chart:
Dow Jones Going Sideways
The Dow Jones Industrial Average daily chart shows that blue-chip index was relatively weaker than the broad stock market and much weaker than record-breaking technology stocks recently, as it continued to trade well below late February local high. The market broke below its early March local low a week ago, and it continued below the level of 24,000. In late February, we saw a negative candlestick pattern called Dark Cloud Cover, a pattern in which the uptrend continues with a long white body, and the next day it reverses following higher open and closes below the mid-point between open and close prices of the previous day. Since then, it acted as a resistance level. The index got close to its February 9 low and it acted as a short-term support level on Friday. Was this an upward reversal or just dead-cat-bounce correction before another leg lower? Well, the market is still below its medium-term downward trend line which is currently at around 25,000:
Concluding, the S&P 500 index may extend its short-term consolidation and continue to fluctuate above support level of 2,600. We may see a lower volatility following Friday's, Monday's and Tuesday's wild swings. Investors will probably step back ahead of long holiday weekend, month's, quarter's end. However, bulls continue to walk on thin ice here, as some more downward pressure may lead stocks to their early February low.
The early March rally failed to continue following monetary policy tightening, trade war fears, negative political news. What was just profit-taking action, quickly became a meaningful downward reversal. Last week's Monday's sell-off and breakdown below over-month-long rising wedge pattern made medium-term bearish case more likely, and after some quick consolidation, the index accelerated lower on Thursday and Friday. Just like we wrote in our several Stocks Trading Alerts, the early February sell-off set the negative tone for weeks or months to come.
If you enjoyed the above analysis and would like to receive free follow-ups, we encourage you to sign up for our daily newsletter – it’s free and if you don’t like it, you can unsubscribe with just 2 clicks. If you sign up today, you’ll also get 7 days of free access to our premium daily Gold & Silver Trading Alerts. Sign up now.
Thank you.
Paul Rejczak
Stock Trading Strategist
Stock Trading Alerts
SunshineProfits.com
Stock market strategist, who has been known for quality of his technical and fundamental analysis since the late nineties. He is interested in forecasting market behavior based on both traditional and innovative methods of technical analysis. Paul has made his name by developing mechanical trading systems. Paul is the author of Sunshine Profits’ premium service for stock traders: Stock Trading Alerts.
* * * * *
Disclaimer
All essays, research and information found above represent analyses and opinions of Paul Rejczak and Sunshine Profits' associates only. As such, it may prove wrong and be a subject to change without notice. Opinions and analyses were based on data available to authors of respective essays at the time of writing. Although the information provided above is based on careful research and sources that are believed to be accurate, Paul Rejczak and his associates do not guarantee the accuracy or thoroughness of the data or information reported. The opinions published above are neither an offer nor a recommendation to purchase or sell any securities. Mr. Rejczak is not a Registered Securities Advisor. By reading Paul Rejczak’s reports you fully agree that he will not be held responsible or liable for any decisions you make regarding any information provided in these reports. Investing, trading and speculation in any financial markets may involve high risk of loss. Paul Rejczak, Sunshine Profits' employees and affiliates as well as members of their families may have a short or long position in any securities, including those mentioned in any of the reports or essays, and may make additional purchases and/or sales of those securities without notice.
Paul Rejczak Archive |
© 2005-2022 http://www.MarketOracle.co.uk - The Market Oracle is a FREE Daily Financial Markets Analysis & Forecasting online publication.